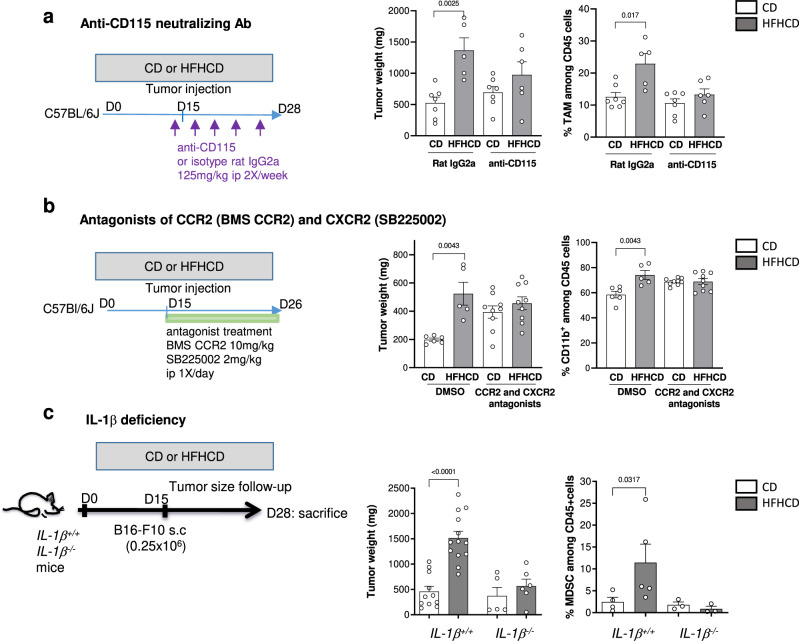
Fig. 4. Impaired myeloid cell accumulation in the tumor limits tumor growth under HFHCD.
C57BL/6J mice, fed with CD or HFHCD and grafted with B16-F10 cells. a Neutralizing anti-CD115 (CSF1R) or isotype (125 mg/kg, ip) was injected one day before tumor graft then every 3 days. (left) Experimental design, (middle) tumor weight and (right) flow cytometry analysis of TAM in the tumor (n = 14 mice on CD, n = 11 mice on HFHCD, among which n = 7 and n = 6 mice were respectively treated with anti-CD115 antibody). b CCR2 antagonist (BMS CCR2, 10 mg/kg, ip) and CXCR2 antagonist (SB225002, 2 mg/kg) were injected every day from the day of tumor graft. (Left) Experimental design, (middle) Tumor weight and (right) flow cytometry analysis of CD11b+ myeloid cells in the tumor. (n = 15 mice on CD, n = 14 mice on HFHCD, among which n = 9 mice per group were treated with the agonist combination). c IL-1β−/− mice (n = 11) and control IL-1β+/+ mice (n = 23) were fed for 2 weeks with CD (n = 5 and n = 10 respectively in each group) or HFHCD (n = 6 and n = 13 respectively in each group), grafted with B16-F10 cells and sacrificed at day 13 post injection. (Left) Tumor weight and (right) flow cytometry analysis of total MDSC (%) in the tumor (n = 4 IL-1β-/- mice on CD, n = 5 IL-1β−/− mice on HFHCD, n = 4 IL-1β+/+ mice on CD, n = 5 IL-1β+/+ mice on HFHCD). Data are expressed as mean ± s.e.m. Analysis of difference within groups were performed with two-sided Mann–Whitney t-test. Source data are provided as a Source Data file.

