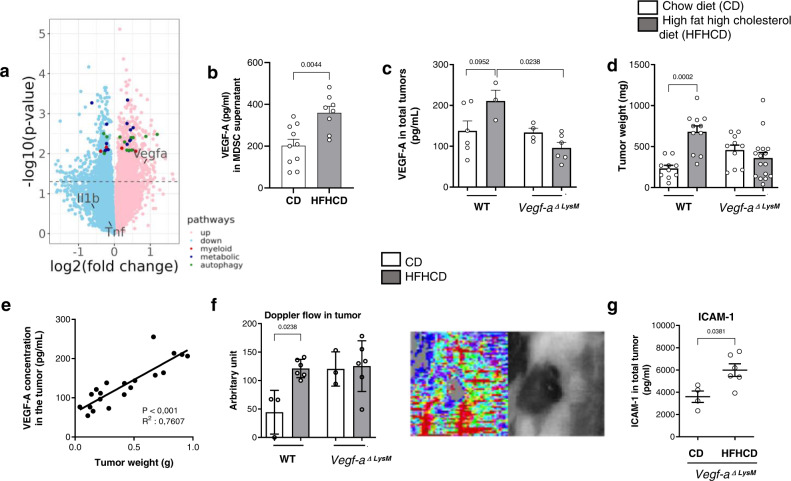
Fig. 5. Myeloid-derived VEGF-A controls tumor growth under HFHCD.
C57BL/6J mice, fed with CD or HFHCD and grafted with B16-F10 cells. a Volcano plot of all expressed genes, with Vegfa and differentially expressed genes from significantly enriched pathway highlighted. b MDSCs were isolated from B16-F10 tumor at day 13 after tumor graft, and cultured for 18 h in complete medium. VEGF-A was measured by bead-based multiplex immunoassay in the supernatant (n = 10 mice in CD group, n = 8 mice in HFHCD group). c–e LysMCre+/−/Vegf-af/f (Vegf-a ΔLysM) and their control littermate LysMCre−/−/Vegf-af/f (WT) mice were fed for 2 weeks with CD or HFHCD, and were transplanted with B16-F10 cells (s.c.). Mice were sacrificed at day 15 post injection. c VEGF-A production in total tumors was measured by ELISA (n = 6 in WT mice on CD, n = 3 in WT mice on HFHCD, n = 4 in Vegf-a Δ LysM mice on CD, n = 6 in Vegf-a ΔLysM mice on HFHCD). d Tumors weight (n = 10 in WT mice on CD, n = 11 in WT mice on HFHCD, n = 10 in Vegf-a Δ LysM mice on CD, n = 16 in Vegf-a ΔLysM mice on HFHCD, two independent experiments combined. Analysis of difference within groups were performed with two-sided Mann–Whitney t-test). e Correlation of VEGF-A concentration in tumor with tumor weight, in VEGF-AΔLysM mice and control littermates, under CD and HFHCD. f Laser Doppler perfusion imaging (PDPI) of tumors at day 9 (Right: representative picture). Mice were positioned on their back on a light-absorbing pad. LDPI image post-processing and measurement standardized protocol: the mean intensity of the Doppler signal was registered in ROI (Region of interest) encompassing the tumor and expressed as numerical value normalized for their area. (n = 3 mice/group in WT mice on CD, n = 6 in WT mice on HFHCD, n = 3 in Vegf-a ΔLysM mice on CD, n = 6 in Vegf-a ΔLysM mice on HFHCD. Analysis of difference within groups were performed with two-sided Mann–Whitney t-test). g ICAM-1 level measured in total tumors of Vegf-a ΔLysM mice on CD (n = 4) and HFHCD (n = 6) by bead-based multiplex immunoassay. Mean ± s.e.m. Two-sided Mann–Whitney t-test and Spearman correlation. Source data are provided as a Source Data file.

