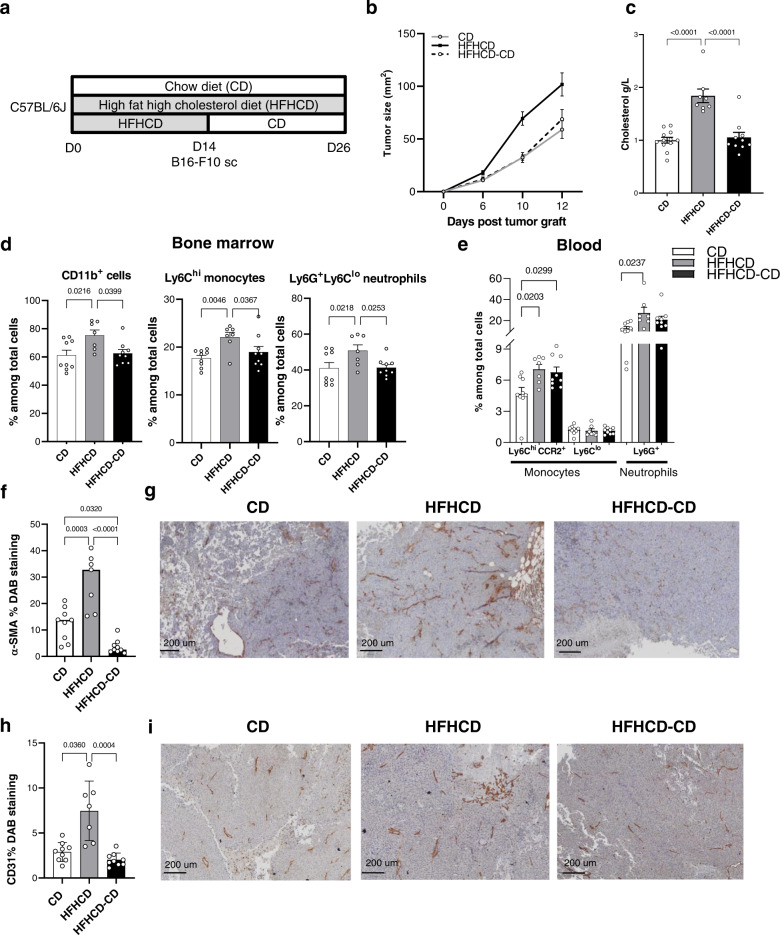
Fig. 6. Switching diet avoid the effect of HFHCD on tumor growth.
C57BL/6J mice were fed for 2 weeks with CD or HFHCD, part of HFHCD –fed mice was switched to CD the day of tumor graft. Mice were transplanted with 0,25 × 10⁶ B16-F10 cells (s.c.) and sacrificed at day 12 post injection. a Experimental design. b Tumor size evolution over time (at day 10 p = 0.0003 CD versus HFHCD and p = 0.002 HFHCD-CD versus HFHCD; at day 12 p = 0.014 CD versus HFHCD and p = 0.010 HFHCD-CD versus HFHCD). c Plasmatic cholesterol concentration (n = 12 in CD group, n = 8 in HFHCD group, n = 10 in HFHCD-CD group). d Flow cytometry analysis of (%) CD11b+myeloid cells, Ly6Chi monocytes and Ly6G+ neutrophils in the bone marrow and e (%) of inflammatory monocytes (Ly6Chi CCR2+), non-classical monocytes (Ly6Clo) and neutrophils (Ly6G+Ly6Clo) in blood. f–i Immunohistochemical staining on FFPE tumors. f Quantification of α-SMA DAB staining and g representative pictures of tumor tissue sections. Scale bar 200 mm. h quantification of CD31 DAB staining and i representative pictures of tumor tissue sections. Scale bar 200 mm. Data are expressed as mean ± s.e.m., one-way ANOVA with Tukey’s multiple comparisons test. N = 9 in CD group, n = 7 in HFHCD group, n = 9 in HFHCD-CD group, unless specified. Source data are provided as a Source Data file.

