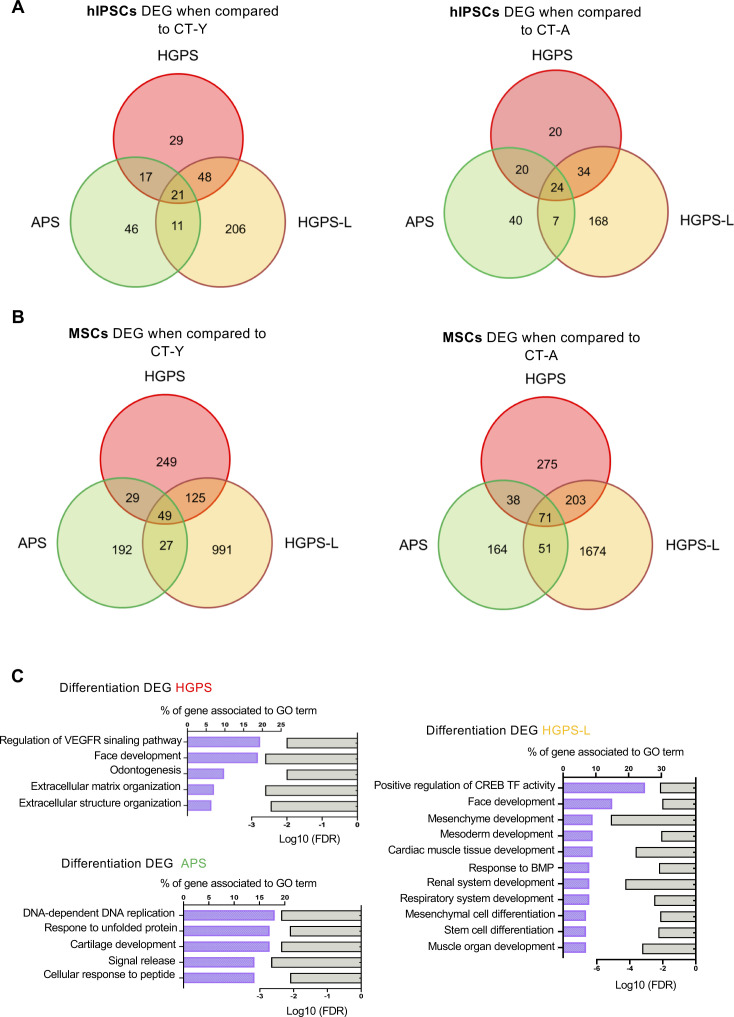
Figure S3. Analysis of differentially expressed genes (DEGs) during the differentiation of hIPSCs into MSCs.
(A) Venn diagram representing the clustering of DEGs in the different pathologies compared with CT-Y (left) and CT-A (right) in hiPSCs cell lines. DEGs lists were generated by comparing the transcriptome from pathological hiPSCs to hiPSCs from either control. We report 21 and 24 DEGs shared between comparison (CT-Y and CT-A, respectively). (B) Venn diagram showing the clustering of DEGs in the different pathologies compared with CT-Y (left) and CT-A (right) in MSCs differentiated from hIPSCs cell lines. Lists of DEGs lists were generated by comparing the transcriptome of pathological MSCs to MSCs from either control. We report 49 and 71 DEGs shared between comparison (CT-Y, CT-A; respectively). (C) Representative deregulated biological processes in each condition, determined using Gene Ontology (GO). Histogram bars are presented with GO terms and the percentage of associated genes, as well as the adjusted P-value of the FDR.

