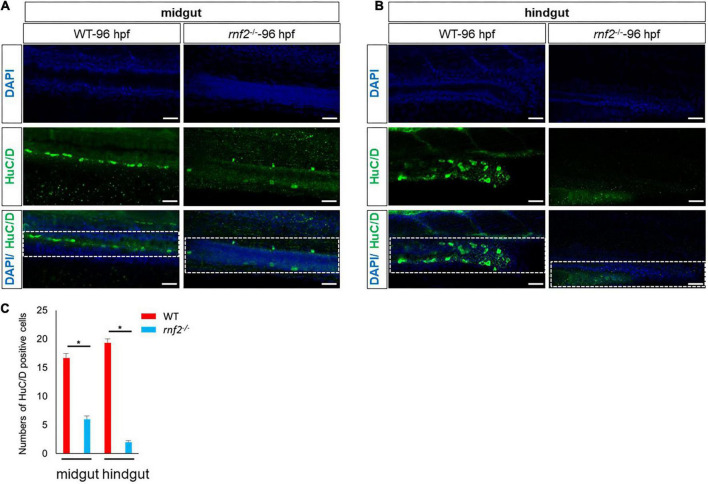
FIGURE 3.
The deficiency of rnf2 decreased the enteric neurons in zebrafish embryos. (A) Confocal images showing HuC/D positive enteric neurons in midgut of rnf2–/– and WT embryos at 96 hpf (40 × oil, lateral view and head is to the left). The white dashed box showing the different distribution of HuC/D+ signals in the midgut of WT and rnf2–/– embryos at 96 hpf. (B) Confocal images showing HuC/D positive enteric neurons in hindgut of rnf2–/– and WT embryos at 96 hpf (40 × oil, lateral view and head is to the left). The white dashed box showing the different distribution of HuC/D+ signals in the hindgut of WT and rnf2–/– embryos at 96 hpf. Scale bar: 0.1 mm. (C) Quantitation of HuC positive cells in (A,B). The numbers of samples were 26 and 21 in 96 hpf WT and rnf2–/– embryos, respectively. The star indicates significant differences at p ≤ 0.05. The experiments were repeated at least three times. Scale bar: 0.1 mm.

