FIGURE 4.
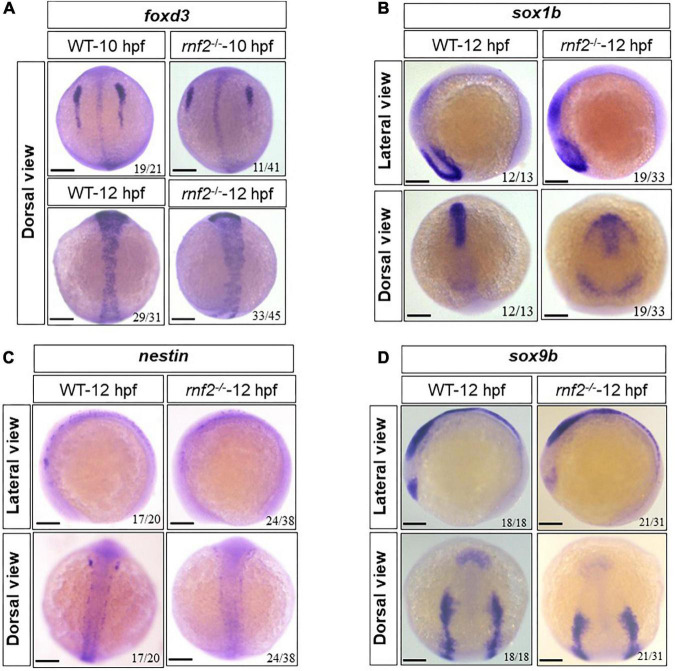
The effect of loss of rnf2 on the specification of neural crest cells. (A) The expression of foxd3 in rnf2–/– and WT embryos at 10 and 12 hpf. Dorsal view. (B) The expression of sox1b in rnf2–/– and WT embryos at 12 hpf. Upper: lateral view, bottom: dorsal view. (C) The expression of nestin in rnf2–/– and WT embryos at 12 hpf. Upper: lateral view, bottom: dorsal view. (D) The expression of sox9b in rnf2–/– and WT embryos at 12 hpf. Upper: lateral view, bottom: dorsal view. The experiments were repeated at least three times. Scale bar = 0.1 mm.

