FIGURE 6.
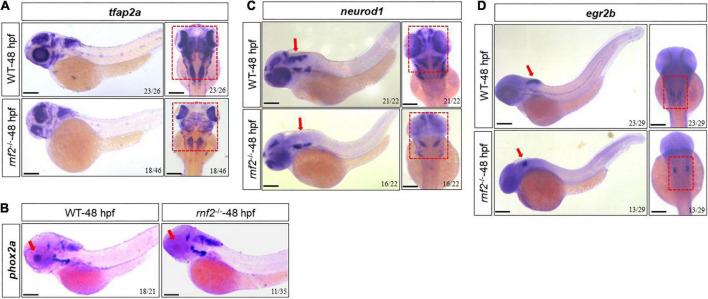
The effect of rnf2 deficiency on central nervous system development in zebrafish embryos. (A) The expression of tfap2a in rnf2–/– and WT embryos at 48 hpf. Left: lateral view; right: dorsal view of the brain. The red dashed boxes showing the different expansion of tfap2a in the brain regions of rnf2–/– embryos at 48 hpf. (B) The expression of phox2a in rnf2–/– and WT embryos at 48 hpf. The red boxes and arrows showing the loss of phox2a expression in the brain regions of mutant embryos. Lateral view. (C) The expression of neurod1 in rnf2–/– and WT embryos at 48 hpf. The red boxes and arrows showing the loss of neurod1 expression in MHB and hindbrain of mutant embryos. Left: lateral view; right: dorsal view of the brain. (D) The expression of egr2b in rnf2–/– and WT embryos at 48 hpf. The red arrows showing the reduced egr2b expression in MHB of mutant embryos. Left: lateral view; right: dorsal view of the brain. The experiments were repeated at least three times. Scale bar = 0.1 mm.

