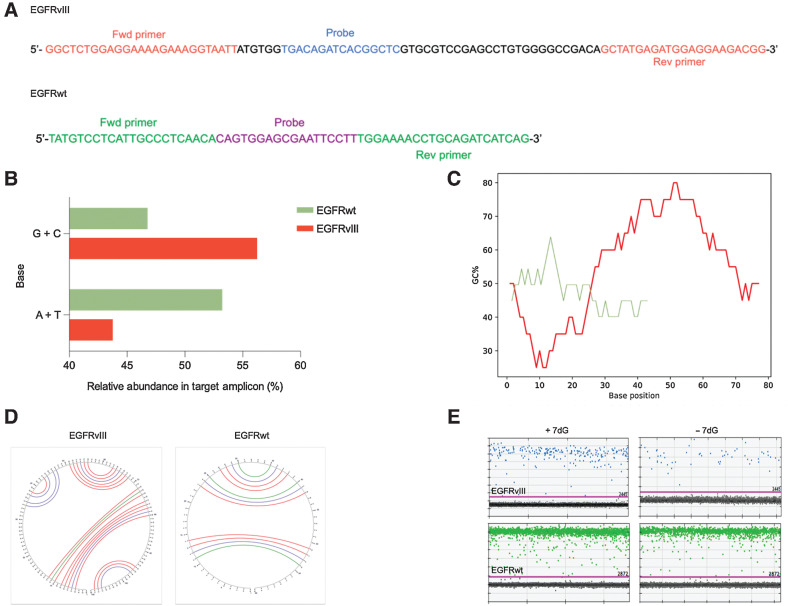
Figure 1.
RNA folding and secondary structures occurring in the EGFR transcript variant III. A, Diagram depicting nucleotide sequence of the target amplicon in the deleted variant of the EGFR transcript (EGFRvIII; top) and wild-type EGFR (bottom). Forward and reverse primers as well as probe sequence specific to each amplicon are illustrated. B, A bar graph comparing the relative abundance (percentage) of different nitrogenous bases (G +C, A +T) in the target amplicons (green = EGFRvIII, red = EGFRwt). C, Graphical representation of GC content distribution across the length of the target amplicon in both sequences (EGFRvIII, red = 96 bp, EGFRwt, green = 62 bp). Calculation of GC content (percentage) is performed using the formula, (G + C)/(A + T + G + C) *100 with the window size set to 20 bases. D, Output of secondary structure analysis using Mfold. The individual base pair interactions in EGFRvIII and EGFRwt target amplicon are illustrated using circle graphs. Each color denoted arc represents a unique base pair interaction (blue = A-U, A-T, red = G-C, green = G-U, G-T). E, Effect of 7dG on the secondary structures and the copy number of EGFRvIII (top) and EGFRwt (bottom) in tumor tissue as shown in dd PCR 1D plots.

