. 2022 Jul 18;28(18):4070–4082. doi: 10.1158/1078-0432.CCR-22-0444

Figure 2.

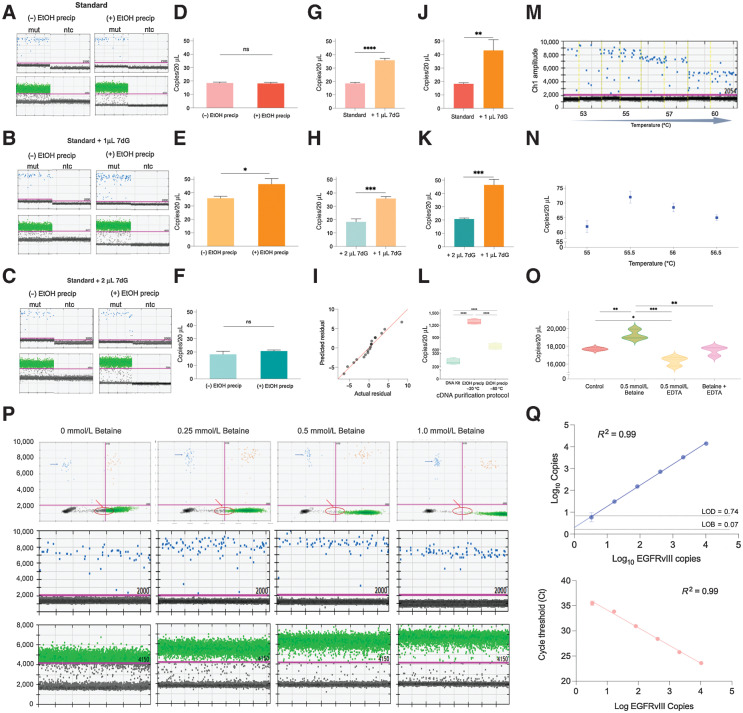
Figure 2. EGFR transcript variant vIII droplet digital PCR (ddPCR) optimization. A–C, ddPCR 1D plots with mutant channel amplitude (blue, top) and GAPDH channel amplitude (green, bottom), run in parallel with (right) and without (left) ethanol precipitation of EGFRvIII cDNA from three different reverse transcription protocols: (a) standard, (b) standard + 1 μL 7-deaza-GTP, (c) standard + 2 μL. D–F, Two-tailed t test results depicting the difference in copies/20 μL from ddPCR using EGFRvIII cDNA treated with and without ethanol precipitation from different reverse transcription protocols; (d) standard, (e) standard + 1 μL 7-deaza-GTP, (f) standard + 2 μL. G, Two-tailed t test results comparing the statistically significant difference in copies/20 μL in EGFRvIII cDNA from standard and (standard + 1 μL 7-deaza-dGTP) RT protocols, both untreated with ethanol precipitation. H, Two-tailed t test results comparing the statistically significant difference in copies/20 μL in EGFRvIII cDNA from (standard + 2 μL 7-deaza-GTP) and (standard + 1 μL 7-deaza-dGTP) RT protocols, both untreated with ethanol precipitation. J, Two-tailed t test results comparing the statistically significant difference in copies/20 μL in EGFRvIII cDNA from standard and (standard + 1 μL 7-deaza-dGTP) RT protocols, treated with ethanol precipitation. K, Two-tailed t test results comparing the statistically significant difference in copies/20 μL in EGFRvIII cDNA from (standard + 2 μL 7-deaza-GTP) and (standard + 1 μL 7-deaza-dGTP) RT protocols, treated with ethanol precipitation. I, QQ plot obtained from one-way ANOVA results depicting statistically significant difference in average copies/20 μL in EGFRvIII cDNA across different conditions overall. L, Two-tailed t test results depicting statistically significant difference in copies/20 μL in EGFRvIII cDNA (standard + 1 μL 7-deaza-dGTP, RT protocol) purified using different cleanup protocols. M, ddPCR 1D plots demonstrating change in separation of mutant events from the baseline at different annealing/extension temperatures (low vs. high). N, Quantitative difference in copies/20 μL of mutant events across different annealing/extension temperatures. O, Violin plots demonstrating statistically significant difference in copies/20 μL with the addition of 0.5 mmol/L betaine, 0.5 mmol/L EDTA, 0.5 mmol/L (betaine + EDTA) versus no addition of ddPCR additive (control). P, ddPCR 2D plots (top row) and 1D plots depicting cluster density, tightness, and separation of mutant events (blue) and GAPDH events (green) at different concentrations of betaine versus no betaine addition to ddPCR. Q, Varying numbers of EGFRvIII synthetic RNA were spiked into the reverse transcription reaction. The resulting cDNA was then amplified using the optimized ddPCR (top) and qPCR (bottom) cycling conditions. For ddPCR, copies per 20 μL are plotted against EGFRvIII copies spike-in (top). Limit of detection (LOD, dashed line) is plotted, defined as 3 standard deviations over average copies per 20 μL obtained when only a small concentration of EGFRvIII was run along with blanks. Limit of blank (LOB, dashed line) is plotted, defined as the apparent highest copy number expected to be found when replicates of a blank sample containing no EGFRvIII (or small concentration of EGFRvIII) are tested. For qPCR cycle threshold (Ct) is plotted against EGFRvIII copies spike-in (bottom).

EGFR transcript variant vIII droplet digital PCR (ddPCR) optimization. A–C, ddPCR 1D plots with mutant channel amplitude (blue, top) and GAPDH channel amplitude (green, bottom), run in parallel with (right) and without (left) ethanol precipitation of EGFRvIII cDNA from three different reverse transcription protocols: (a) standard, (b) standard + 1 μL 7-deaza-GTP, (c) standard + 2 μL. D–F, Two-tailed t test results depicting the difference in copies/20 μL from ddPCR using EGFRvIII cDNA treated with and without ethanol precipitation from different reverse transcription protocols; (d) standard, (e) standard + 1 μL 7-deaza-GTP, (f) standard + 2 μL. G, Two-tailed t test results comparing the statistically significant difference in copies/20 μL in EGFRvIII cDNA from standard and (standard + 1 μL 7-deaza-dGTP) RT protocols, both untreated with ethanol precipitation. H, Two-tailed t test results comparing the statistically significant difference in copies/20 μL in EGFRvIII cDNA from (standard + 2 μL 7-deaza-GTP) and (standard + 1 μL 7-deaza-dGTP) RT protocols, both untreated with ethanol precipitation. I, QQ plot obtained from one-way ANOVA results depicting statistically significant difference in average copies/20 μL in EGFRvIII cDNA across different conditions overall. J, Two-tailed t test results comparing the statistically significant difference in copies/20 μL in EGFRvIII cDNA from standard and (standard + 1 μL 7-deaza-dGTP) RT protocols, treated with ethanol precipitation. K, Two-tailed t test results comparing the statistically significant difference in copies/20 μL in EGFRvIII cDNA from (standard + 2 μL 7-deaza-GTP) and (standard + 1 μL 7-deaza-dGTP) RT protocols, treated with ethanol precipitation. L, Two-tailed t test results depicting statistically significant difference in copies/20 μL in EGFRvIII cDNA (standard + 1 μL 7-deaza-dGTP, RT protocol) purified using different cleanup protocols. M, ddPCR 1D plots demonstrating change in separation of mutant events from the baseline at different annealing/extension temperatures (low vs. high). N, Quantitative difference in copies/20 μL of mutant events across different annealing/extension temperatures. O, Violin plots demonstrating statistically significant difference in copies/20 μL with the addition of 0.5 mmol/L betaine, 0.5 mmol/L EDTA, 0.5 mmol/L (betaine + EDTA) versus no addition of ddPCR additive (control). P, ddPCR 2D plots (top row) and 1D plots depicting cluster density, tightness, and separation of mutant events (blue) and GAPDH events (green) at different concentrations of betaine versus no betaine addition to ddPCR. Q, Varying numbers of EGFRvIII synthetic RNA were spiked into the reverse transcription reaction. The resulting cDNA was then amplified using the optimized ddPCR (top) and qPCR (bottom) cycling conditions. For ddPCR, copies per 20 μL are plotted against EGFRvIII copies spike-in (top). Limit of detection (LOD, dashed line) is plotted, defined as 3 standard deviations over average copies per 20 μL obtained when only a small concentration of EGFRvIII was run along with blanks. Limit of blank (LOB, dashed line) is plotted, defined as the apparent highest copy number expected to be found when replicates of a blank sample containing no EGFRvIII (or small concentration of EGFRvIII) are tested. For qPCR cycle threshold (Ct) is plotted against EGFRvIII copies spike-in (bottom).