Figure 3.
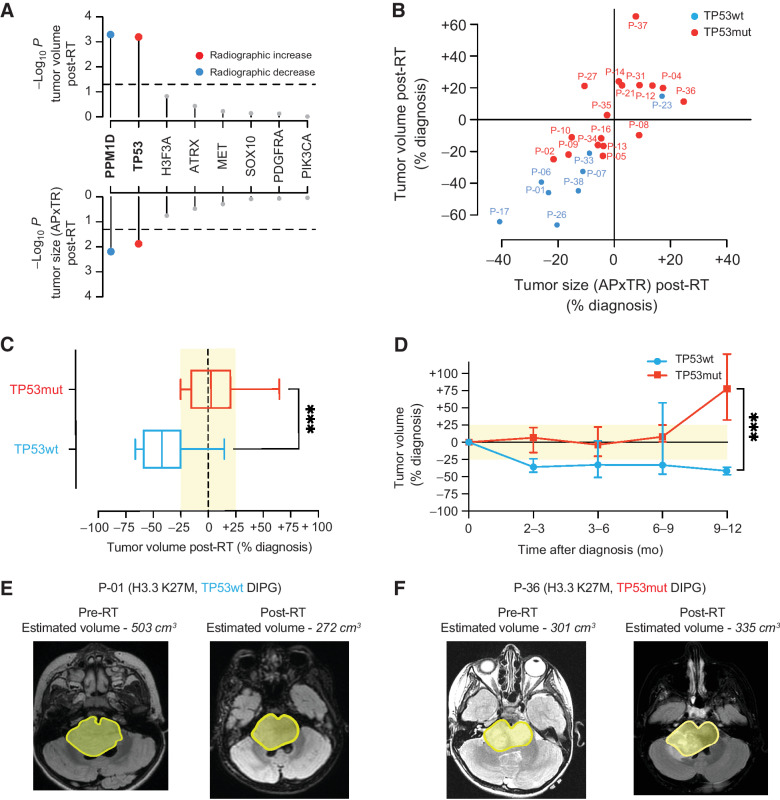
Somatic TP53 mutations predict poor radiographic response after radiotherapy in patients with H3K27-altered DIPG. A, Association between somatic driver gene status and change in tumor volume (top) and tumor size measured by anterior-posterior (AP) and transverse (TR) dimensions (bottom) post-RT (n = 25 H3K27-altered DIPG patients with available pre- and post-RT MRI data). Colored dots show mutant driver genes that are significantly (P < 0.05) associated with an increase (red) or decrease (blue) in tumor volume/size post-RT. B, Scatter plot comparing the percentage of change pre- and post-RT tumor volume versus tumor size across TP53mut (n = 17; red dots) and TP53wt (n = 8, blue dots) H3K27-altered DIPG. C, Box plot comparing tumor volumes stratified by TP53 mutation status based on post-RT MR images in patients enrolled in PNOC003 (TP53mut, n = 17, red box; TP53wt, n = 8, blue box). D, Line graph showing longitudinal changes in tumor volume from time of initial diagnosis up to 12 months from subjects enrolled in PNOC003 based on volumetric tumor assessment on MRI (n = 99 MRI scans; TP53mut, n = 17, red line; TP53wt, n = 8, blue line). E and F show a representative example of pre- and post-RT MRI tumor volume for patients with a TP53wt (C) and TP53mut (F) H3.3 K27M-mutant DIPG. Yellow area marks tumor outline. RT, radiotherapy; wt, wild-type; mut, mutant; MRI, magnetic resonance imaging; AP, anterior–posterior; TR, transverse. ***, P < 0.001.

