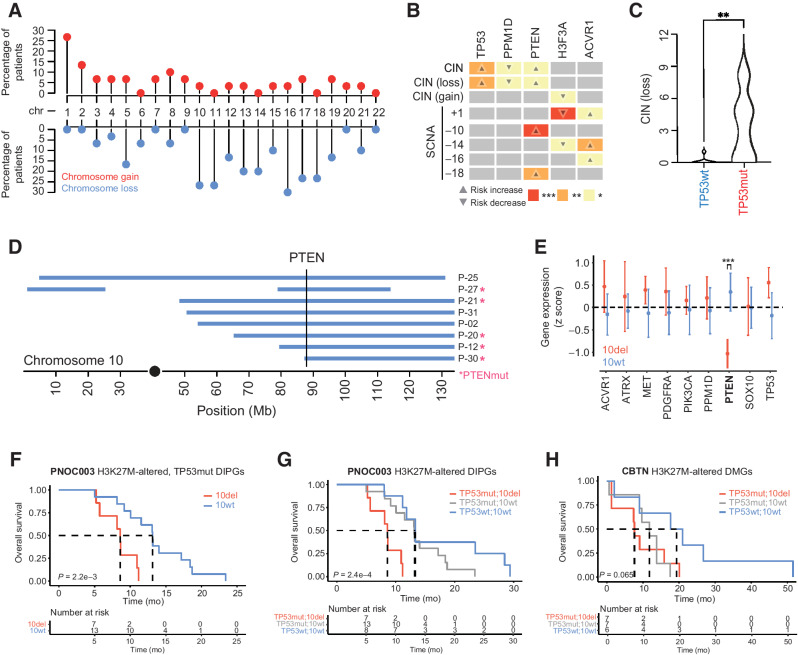
Figure 4.
Somatic driver gene alterations are associated with distinct patterns of chromosome instability in H3K27-altered DIPG. A, Lollipop plot showing the frequency of somatic chromosomal gain and loss events in H3K27-altered DIPGs (n = 30). Percentages on the left show the proportion of primary tumors with chromosomal gains or losses (middle row). Red dots represent full/partial chromosome gains; blue dots represent full/partial chromosome losses. B, Association between somatic driver gene alterations (top side), CIN (left side), and SCNAs (left side) in H3K27-altered DIPGs. Box color and associated number of asterisks indicate the degree of statistical significance (colored boxes). Direction of the arrow indicates an increased risk of association (up-arrow) or decreased risk of association (down-arrow). C, Plot shows the total number of chromosomal losses in TP53mut (n = 20) and TP53wt (n = 8) H3K27-altered DIPGs. D, Somatic PTEN alterations are associated with SCNAs on 10q. Plot shows the genomic position of somatic deletions (blue bars) on chromosome 10 and somatic PTEN alterations (pink asterisk). The vertical line marks the genomic location of the PTEN gene. E, Association between driver gene expression and 10q deletion status in H3K27M-altered DIPG. PTEN expression is significantly reduced in DIPGs that harbor a 10q deletion (Mann–Whitney U test). F, Kaplan–Meier survival curves show poor clinical outcomes in H3K27-altered, TP53-mutant DIPG patients in PNOC003. G and H, Kaplan–Meier survival curves for PNOC003 (C) and CBTN (D) H3K27-altered DIPG/DMG patients after stratification into three genetically defined risk groups: TP53mut/10del (red, highest risk), TP53mut/10wt (gray, intermediate risk), and TP53wt/10wt (blue, lowest risk). SCNA, somatic copy-number alterations; CIN, chromosomal instability; wt, wild-type; mut, mutant; del, deletion; CBTN, Children's Brain Tumor Network; ***, P < 0.001; **, P < 0.01; *, P < 0.05.

