. 2022 Jul 6;28(18):4056–4069. doi: 10.1158/1078-0432.CCR-22-1102

Figure 3.

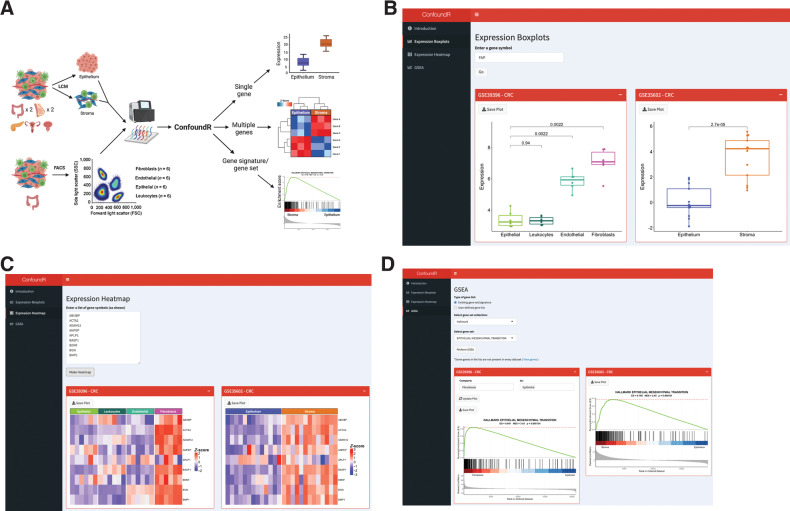
Figure 3. The ConfoundR resource enables stromal influence estimation in cancer tissue. A, Schematic overview of the cohorts and analyses available within the ConfoundR app, accessible via https://confoundr.qub.ac.uk/. B, Expression Boxplots analysis module of ConfoundR enabling the expression of a single gene to be compared between stroma and epithelium samples in each of the ConfoundR datasets. C, Expression Heatmap analysis module of ConfoundR enabling the expression of multiple genes to be visually compared between stroma and epithelium samples in each of the ConfoundR datasets. D, GSEA analysis module of ConfoundR allowing GSEA of existing gene sets from established gene set collections or custom user defined gene sets to be performed comparing stroma with epithelium in each of the ConfoundR datasets.

The ConfoundR resource enables stromal influence estimation in cancer tissue. A, Schematic overview of the cohorts and analyses available within the ConfoundR app, accessible via https://confoundr.qub.ac.uk/. B, Expression Boxplots analysis module of ConfoundR enabling the expression of a single gene to be compared between stroma and epithelium samples in each of the ConfoundR datasets. C, Expression Heatmap analysis module of ConfoundR enabling the expression of multiple genes to be visually compared between stroma and epithelium samples in each of the ConfoundR datasets. D, GSEA analysis module of ConfoundR allowing GSEA of existing gene sets from established gene set collections or custom user defined gene sets to be performed comparing stroma with epithelium in each of the ConfoundR datasets.