. 2022 Jul 6;28(18):4056–4069. doi: 10.1158/1078-0432.CCR-22-1102

Figure 5.

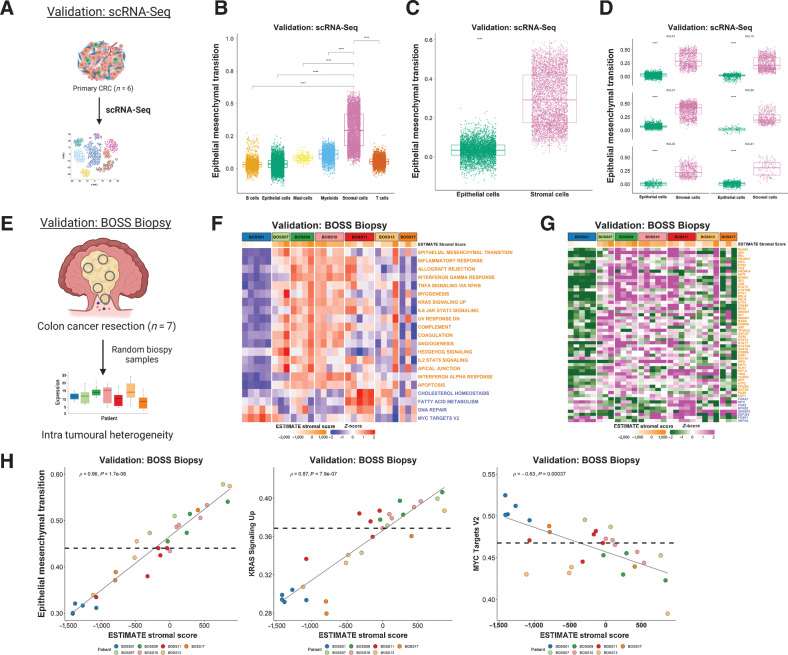
Figure 5. Single-cell and multi-regional biopsy analyses. A, Schematic of scRNA-seq cohort derived from n = 6 colorectal cancer primary tumors. Boxplots showing ssGSEA scores for the Hallmark Epithelial Mesenchymal Transition gene set across the various cell types (B) and specifically between epithelial and stromal cells (C; from all six colorectal cancer tumors) in the scRNA-seq dataset (P < 2.2 × 10⁻¹⁶; Wilcoxon test). D, Comparison of ssGSEA scores for the Hallmark Epithelial Mesenchymal Transition gene set between epithelial and stromal cells in each primary CRC (n = 6) in the scRNA-seq dataset (all P < 2.2×10⁻¹⁶; Wilcoxon test). Epithelial cells are shown in green and stromal cells in pink. E, Schematic overview of the BOSS Biopsy cohort consisting of colon cancer resections from 7 patients each with up to n = 5 multi-regional biopsy samples. Heatmaps of ssGSEA scores for the Hallmark gene sets (F) and TF activity scores for the BOSS Biopsy samples (G). Samples are grouped according to patient of origin and the ESTIMATE Stromal Score of each biopsy sample is indicated by the ESTIMATE StromalScore bar at the top of the heatmap. Only the gene sets/TFs significantly and concordantly enriched in stroma or epithelium in both the LCM discovery and LCM validation cohorts are shown (from Fig. 2; Padj < 0.02 – Hallmarks; P < 0.05 – TFs). Gene sets/TFs with names/symbols colored orange were significantly enriched in stroma in the LCM discovery and LCM validation cohorts and gene sets/transcription factors with names/symbols colored blue were significantly enriched in epithelium in the LCM discovery and LCM validation cohorts. H, Scatterplots showing correlation between the ESTIMATE StromalScore and ssGSEA scores for the Hallmark Epithelial Mesenchymal Transition (left; Spearman rho = 0.96, P = 1.7e-08), KRAS Signaling Up (middle; Spearman rho = 0.87, P = 7.9e-07) and MYC Targets V2 (right; Spearman rho = -0.63, P = 0.00037) gene sets. Samples are colored by patient of origin. CRC, colorectal cancer.

Single-cell and multi-regional biopsy analyses. A, Schematic of scRNA-seq cohort derived from n = 6 CRC primary tumors. Boxplots showing ssGSEA scores for the Hallmark Epithelial Mesenchymal Transition gene set across the various cell types (B) and specifically between epithelial and stromal cells (C; from all six colorectal cancer tumors) in the scRNA-seq dataset (P < 2.2 × 10⁻¹⁶; Wilcoxon test). D, Comparison of ssGSEA scores for the Hallmark Epithelial Mesenchymal Transition gene set between epithelial and stromal cells in each primary CRC (n = 6) in the scRNA-seq dataset (all P < 2.2×10⁻¹⁶; Wilcoxon test). Epithelial cells are shown in green and stromal cells in pink. E, Schematic overview of the BOSS Biopsy cohort consisting of colon cancer resections from 7 patients each with up to n = 5 multi-regional biopsy samples. Heatmaps of ssGSEA scores for the Hallmark gene sets (F) and TF activity scores for the BOSS Biopsy samples (G). Samples are grouped according to patient of origin and the ESTIMATE Stromal Score of each biopsy sample is indicated by the ESTIMATE StromalScore bar at the top of the heatmap. Only the gene sets/TFs significantly and concordantly enriched in stroma or epithelium in both the LCM discovery and LCM validation cohorts are shown (from Fig. 2; Padj < 0.02 – Hallmarks; P < 0.05 – TFs). Gene sets/TFs with names/symbols colored orange were significantly enriched in stroma in the LCM discovery and LCM validation cohorts and gene sets/transcription factors with names/symbols colored blue were significantly enriched in epithelium in the LCM discovery and LCM validation cohorts. H, Scatterplots showing correlation between the ESTIMATE StromalScore and ssGSEA scores for the Hallmark Epithelial Mesenchymal Transition (left; Spearman rho = 0.96, P = 1.7e-08), KRAS Signaling Up (middle; Spearman rho = 0.87, P = 7.9e-07) and MYC Targets V2 (right; Spearman rho = −0.63, P = 0.00037) gene sets. Samples are colored by patient of origin. CRC, colorectal cancer.