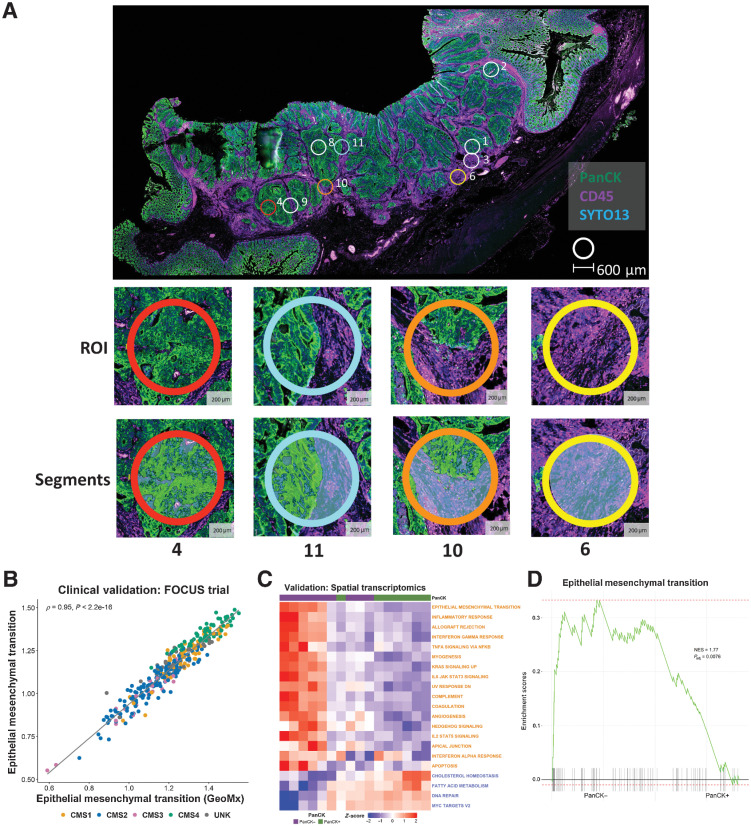
Figure 6.
Spatial transcriptomic confirms the confounding effects of the stroma. A, Whole slide image of colon cancer case selected for spatial transcriptomic analysis. The tissue was stained with PanCK and CD45 with PanCK+ regions (green) identifying epithelium and CD45+ regions (purple) identifying immune components. Small circles indicate the ROIs selected for spatial transcriptomic analysis; ROI 4: high epithelial content, ROI 11: mixed epithelial content, ROI 10 demonstrates a ROI with low epithelial content, ROI 6: no epithelial content. B, Scatterplot showing the correlation between ssGSEA scores for the full Hallmark Epithelial Mesenchymal Transition gene set (n = 200 genes) and the corresponding reduced GeoMx Epithelial Mesenchymal Transition gene set (n = 81 genes) in the FOCUS clinical trial cohort (Spearman rho = 0.95). Samples colored by CMS calls (CMS1: n = 62; CMS2: n = 155; CMS3: n = 29; CMS4: n = 66; UNK: n = 44). C, Heatmap of ssGSEA scores for the Hallmark gene sets for the PanCK+ (epithelium; n = 8) and PanCK− (stroma; n = 11) areas within the regions of interest. Only the Hallmark gene sets identified as significantly and concordantly enriched in stroma or epithelium in both the LCM discovery and LCM validation cohorts are shown (the GeoMx versions of these Hallmark gene sets were used). D, GSEA comparing PanCK− areas (stroma; n = 11) to PanCK+ areas (epithelium; n = 8) for the Hallmark Epithelial Mesenchymal Transition gene set (GeoMx version). CMS, consensus molecular subtypes; LCM, laser capture microdissection; NES, normalized enrichment scale; ROI, region of interest.

