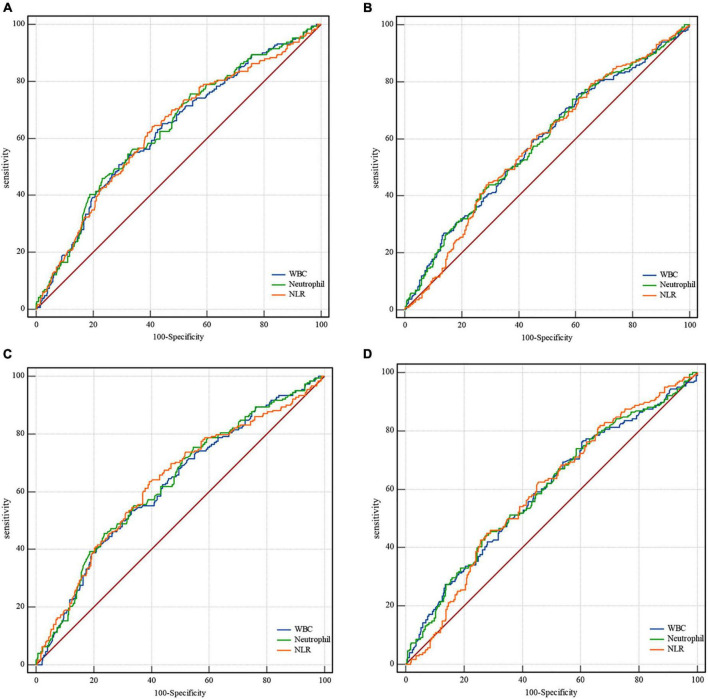
FIGURE 1.
Receiver operating characteristic curves for clinical outcomes. In all patients, the area under the curve for mRS 0–3 is (A) 0.627, confidence interval (CI) 0.59–0.67 for leukocytes; 0.634, CI 0.59–0.67 for neutrophils; 0.629, CI 0.59–0.67 for NLR. The area under the curve for mortality in all patients is (B) 0.587, CI 0.55–0.63 for leukocytes; 0.589, CI 0.55–0.63 for neutrophils; 0.580, CI 0.54–0.62 for NLR. In successfully recanalized patients, the area under the curve for mRS 0-3 is (C) 0.622, CI 0.58-0.67 for leukocytes; 0.630, CI 0.59–0.67 for neutrophils; and 0.630, CI 0.59–0.67 for NLR. The area under the curve for mortality in these patients is (D) 0.594, CI 0.55-0.64 for leukocytes; 0.597, CI 0.55–0.64 for neutrophils; and 0.591, CI 0.55–0.64 for NLR. mRS, modified Rankin Scale; CI, confidence interval; NLR, neutrophil-to-lymphocyte ratio.

