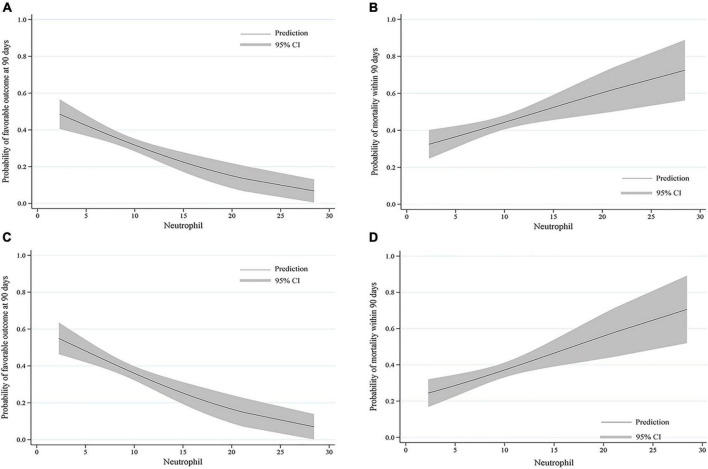
FIGURE 3.
Predicted probability of clinical outcomes by neutrophil count. The curves show a decrease in the estimated probability of favorable outcomes and an increase in the predicted probability of mortality with higher neutrophil counts in (A,B) all patients and (C,D) patients who were successfully recanalized. The solid line shows the predicted probability of outcomes. The shaded area indicates the 95% confidence interval (CI).

