Figure 2.
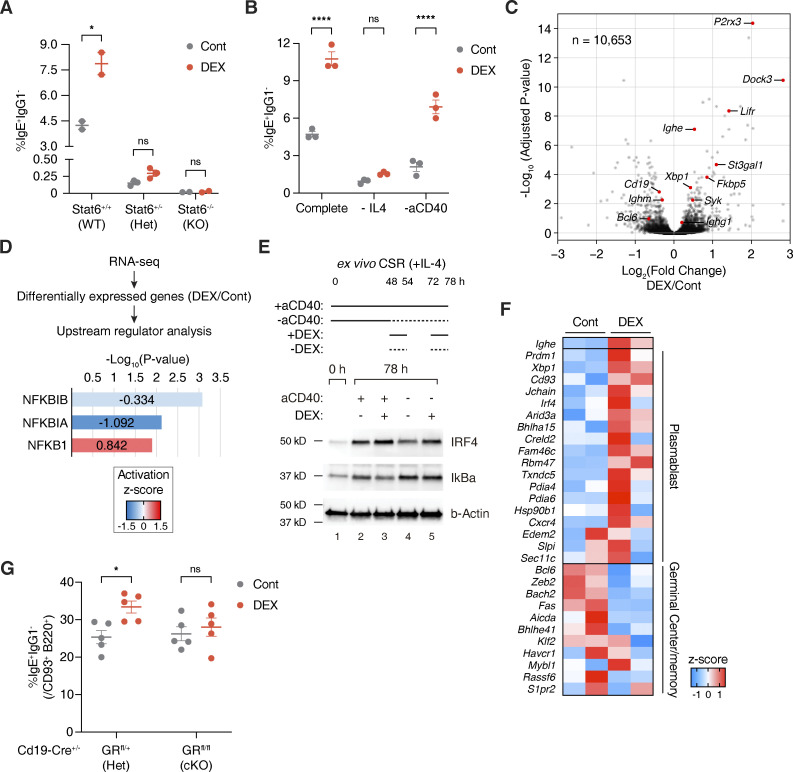
Glucocorticoids promote CD40 signaling and plasmablast-like gene expression ex vivo. (A) Percentage of IgE+ IgG1− B cells (within live B220+) from CD19+ splenic B cells of Stat6 WT, Het, or KO mice cultured with Cont (gray) or DEX (red), as described in Fig. 1 C (n = 2–3 mice/group, representative of two independent experiments). (B) Percentage of IgE+ IgG1− B cells (within live B220+) from WT B cells subjected to IL-4 or aCD40 depletion and treated with Cont (gray) or DEX (red). “Complete” media contained IL-4 and aCD40 (n = 3 mice/group, representative of two independent experiments). (C) Volcano plot showing differentially expressed genes between B cells cultured ex vivo with DEX or Cont. x axis indicates log2(fold change) of counts per million (CPM) and y axis indicates corresponding −log10(adjusted P value) for differential expression, with key B cell or differentially expressed genes highlighted in red (n = 2 mice/group as biological replicates). (D) Effect of DEX on B cell activation of upstream regulators NFKB1 (p105), NFKBIA (IκBa), and NFKBIB (IκBb). WT Cont or DEX-treated B cells were analyzed by RNA-seq and pathway analysis for upstream regulators of differentially expressed targets. x axis indicates −log10(P value) for overlap between DEX-induced changes in upstream regulator targets and observed gene expression changes (relative to Cont), by Fisher’s exact test. Numbers and color gradations indicate activation z-score (n = 2 mice/group as biological replicates). (E) Effect of DEX treatment during aCD40 depletion on IRF4 and IκBa protein abundance by Western blotting. WT B cells were harvested preculture (naive B cells) or after 78 h of complete (lanes 2–3) or aCD40-depleted (lanes 4–5) cultures with Cont or Dex treatment, as similarly described in B (representative of two biological replicates). (F) Heat map showing relative expression of genes associated with plasmablast-like or germinal center and memory B cell–like signatures for Cont vs. DEX-treated IgE+ B cells sorted after culture. Color gradations indicate z-scores by CPM (n = 2 mice/group as biological replicates). (G) Percentage of IgE+ IgG1− cells (within live B220+ CD93+) from Cd19-Cre+/− GR Het vs. cKO B cells cultured with Cont (gray) or DEX (red; n = 5 mice/group, compiled from two independent experiments). Error bars in A–B and G represent SEM. P values <0.05 were considered significant (*, P < 0.05; ****, P < 0.0001; ns, not significant). Ratio-paired Student’s t test was used for A–B and G. Source data are available for this figure: SourceData F2.

