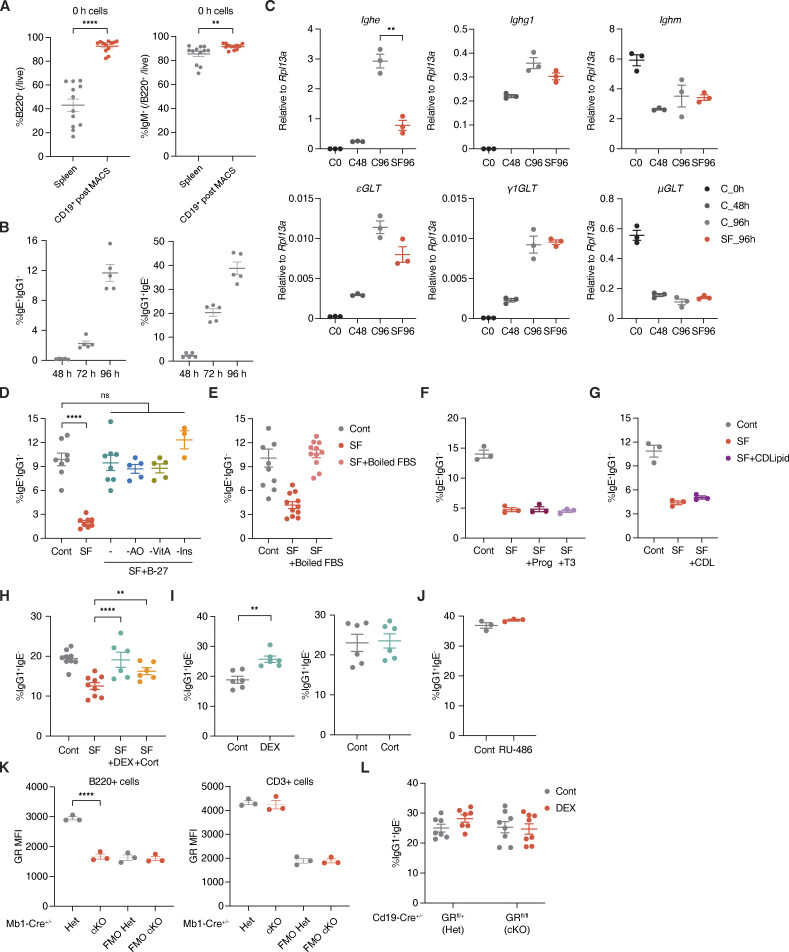
Figure S1.
IgG1 switching is nearly unaffected by glucocorticoids. (A) Percentage of B220+ B cells or IgM+ B cells prior to culture (0 h; n = 12 mice/group, compiled from four independent experiments). (B) Percentage of IgE+ IgG1− or IgG1+ IgE− B cells (within live B220+) from B cells cultured ex vivo for 48, 72, or 96 h (n = 5 mice/group, compiled from two independent experiments). (C) Relative RT-qPCR expression of mature Ighe, Ighg1, or Ighm transcripts (top) and upstream εGLTs, γ1GLTs, or μGLTs (bottom) for B cells preculture (C0, black), after 48 or 96 h in Cont media (C48, dark gray, or C96, light gray), or after 96 h with SF conditions in two 6-h windows (SF96, red), as similarly described in Fig. 1 C. Expression was normalized by Rpl13a (n = 3 mice/group). (D) Percentage of IgE+ IgG1− B cells (within live B220+) from B cells cultured in Cont media (gray), SF conditions (red), SF conditions with B-27 (teal), or SF conditions with B-27 variants lacking antioxidants (AO, blue), vitamin A (VitA, green), or insulin (Ins, orange; n = 6–8 mice/group, compiled from three independent experiments). (E) Percentage of IgE+ IgG1− B cells (within live B220+) from B cells cultured in Cont media (gray), SF conditions (red), or SF conditions with boiled FBS (pink; n = 10–11 mice/group, compiled from four independent experiments). (F) Percentage of IgE+ IgG1− B cells (within live B220+) from B cells cultured in Cont media (gray), SF conditions (red), SF conditions with progesterone (Prog, dark purple), or SF conditions with T3 (light purple; n = 3 mice/group). (G) Percentage of IgE+ IgG1− B cells (within live B220+) from B cells cultured in Cont media (gray), SF conditions (red), or SF conditions with chemically defined lipids (CDlipid or CDL, purple; n = 3 mice/group). (H) Percentage of IgG1+ IgE− B cells (within live B220+) from B cells cultured in Cont media (gray), SF conditions (red), SF conditions with DEX (teal), or SF conditions with Cort (orange) (n = 6–9 mice/group, compiled from three independent experiments). (I) Percentage of IgG1+ IgE− B cells (within live B220+) from B cells cultured in complete media with Cont (gray) or with DEX or Cort (teal, left and right, respectively; n = 6 mice/group, compiled from two independent experiments). (J) Percentage of IgG1+ IgE- B cells (within live B220+) from B cells cultured with Cont vehicle (gray) or RU-486 (red; n = 3 mice/group, representative of two independent experiments). (K) GR expression for live B220+ B cells or live CD3+ T cells in Mb1-Cre+/− GR Het (gray) vs. cKO (red) mice. Numbers indicate GR MFI from stained PBMCs or their FMO controls by flow cytometry (n = 3 mice/group). (L) Percentage of IgG1+ IgE− B cells (within live B220+) from Cont (gray) or DEX-treated (red) Cd19-Cre+/− GR Het vs. cKO B cells (n = 6–7 mice/group, compiled from three independent experiments). Error bars in A–L represent SEM. P values <0.05 were considered significant (**, P < 0.01; ****, P < 0.0001; ns, not significant). Ratio paired Student’s t test was used for A–J and L, and one-way ANOVA with post hoc Tukey’s multiple comparisons test was used for K.

