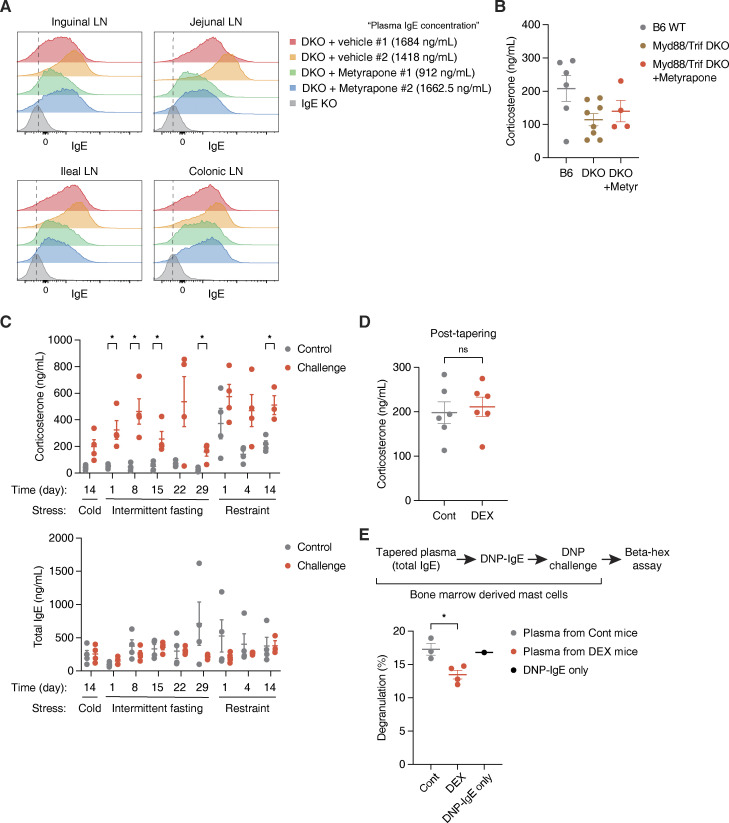
Figure S4.
Natural IgE is produced by local glucocorticoids in the gut, rather than by organismal stress conditions. (A) Local IgE levels across various LNs from representative DKO mice after 3 wk of vehicle treatment (rows 1–2), DKO mice after 3 wk of metyrapone treatment (rows 3–4), and naive IgE KO mouse (row 5). x axis indicates absolute IgE MFI of FO B cells, as described in Fig. 3 D and Fig. S3 D. Corresponding systemic IgE concentrations are listed in the legend. Dashed vertical lines mark peak IgE KO values. (B) Plasma Cort concentration at ZT4 for naive B6 mice at steady state (gray), naive DKO mice at steady state or with Cont treatment (brown), or DKO mice treated for 1 wk with metyrapone (Metyr, red). B6 mice were 6 wk old upon bleeding, and DKO mice were 6–6.5 wk old at experiment start (n = 4–8 mice/group, compiled across two independent experiments). (C) Plasma Cort concentration (top) and total plasma IgE concentration (bottom) at ZT4 for WT mice throughout exposures to different physiological stress conditions. 6–8 wk old mice at experiment start were subjected to either no challenge (Control), cold challenge across 14 d, intermittent fasting across 29 d, or restraint stress across 14 d (n = 2–4 mice/group). (D) Level of plasma Cort at ZT4 after 4 wk of Cont (gray) vs. DEX (red) treatment followed by 2 wk of tapering (n = 6 mice/group). (E) Effects of bound natural IgE on bone marrow–derived mast cell degranulation ex vivo. Mast cells were preincubated without plasma (black) or with plasma from tapered Cont (gray) or DEX-treated (red) mice, and then induced to degranulate using DNP-IgE and DNP-HSA, as represented by the experimental setup. Numbers indicate percentage of degranulated mast cells, quantified by colorimetric assay for β-hex release (n = 4 mice/group, representative of two independent experiments). Error bars in B–E represent SEM. P values <0.05 were considered significant (*, P < 0.05). Unpaired Student’s t test was used for C and Welch’s t test was used for D and E.

