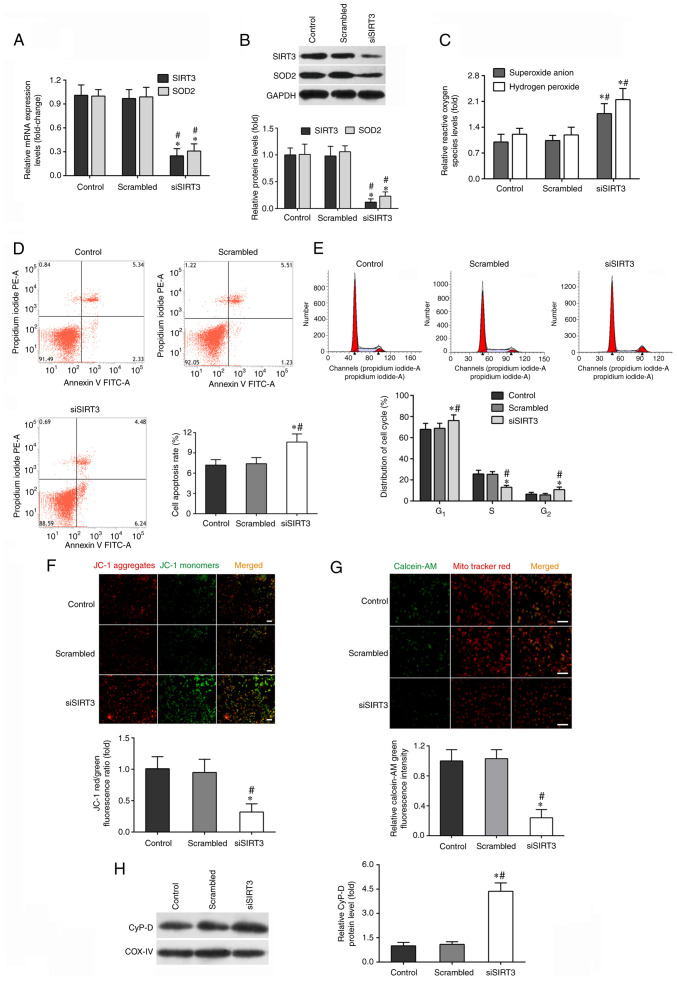
Figure 2.
SIRT3 knockdown by siRNA transfection impairs DAC function. DACs were treated with SIRT3 siRNA (siSIRT3 group) or scrambled siRNA, then co-cultured with activated-microglia for 48 h. Microglia were exposed to 1 µg/ml lipopolysaccharide. (A) Reverse transcription-quantitative PCR was performed to measure the mRNA expression of SIRT3 and SOD2 in DACs. (B) The protein levels of SIRT3 and SOD2 in DACs were determined using western blotting. (C) The fluorescent probe dihydroethidium was used to detect intracellular superoxide anion level, and a hydrogen peroxide assay kit was used to detect intracellular hydrogen peroxide level in DACs. (D) Cell apoptosis rate and (E) cell cycle distribution of DACs in the Control, Scrambled and siSIRT3 groups were measured using flow cytometry. (F) The fluorescence probe JC-1 was used to detect the loss of mitochondrial membrane potential. Scale bar, 100 µm. (G) Mitochondrial calcein-AM green fluorescence intensity was examined using flow cytometry to evaluate the number of the membrane permeability transport pores opening in DACs. MitoTracker (red) staining indicates the localization of mitochondria. Scale bar, 50 µm. (H) Protein level of mitochondrial cyclophilin D in DACs was determined using western blotting. Data in A, B, C, F, G and H are shown as fold change over Control group. Data are presented as mean ± S.D. n=4. *P<0.05 vs. Control; #P<0.05 vs. Scrambled. SIRT3, sirtuin 3; DAC, dopaminergic neuronal cell; si/siRNA, small interfering RNA; SOD2, superoxide dismutase 2; JC-1, tetraethylbenzimidazolylcarbocyanine iodide.

