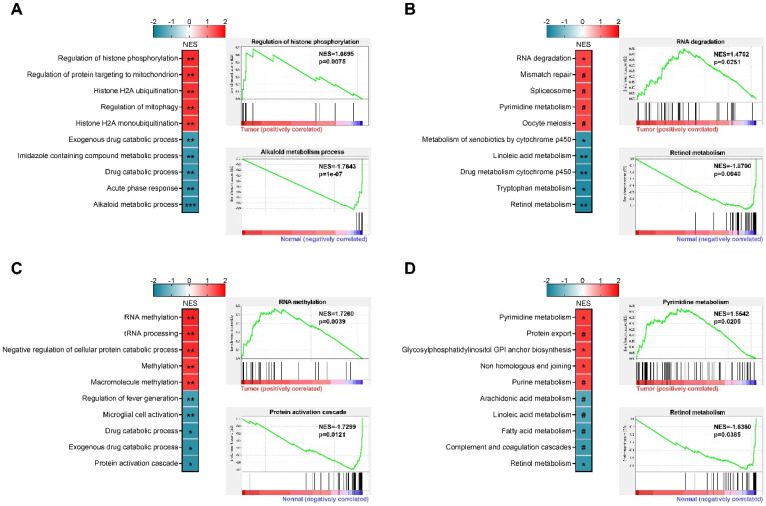
Figure 4.
Sex-based gene set enrichment analysis. (A) Top 5 positively and negatively enriched GO terms in female patients, representative enrichment plots were presented. (B) Top 5 positively and negatively enriched KEGG pathways in female patients, representative enrichment plots were presented. (C) Top 5 positively and negatively enriched GO terms in male patients, representative enrichment plots were presented. (D) Top 5 positively and negatively enriched KEGG pathways in male patients, representative enrichment plots were presented. NES, normalized enrichment score; ***p<0.001, **p<0.01, *p<0.05, #p>0.05.

