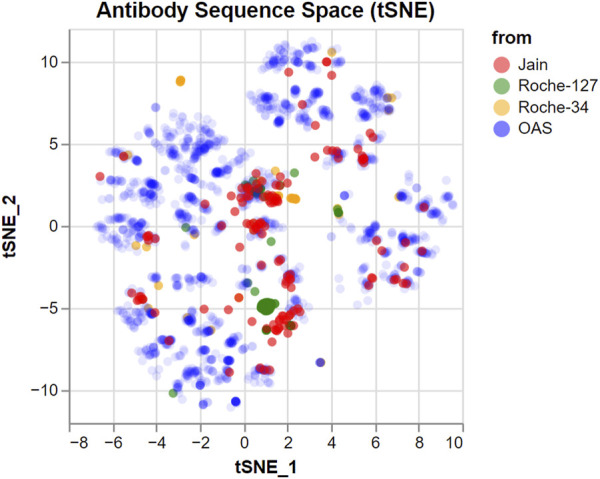
FIGURE 1.

tSNE embedding of the sequence space covered by the datasets used in this study. 2,000 random sequences from the OAS dataset are added for comparison, with a lower opacity. Groups of nearby points represent similar sequences which are different from the others. However, larger distances between groups should not be over-interpreted.
