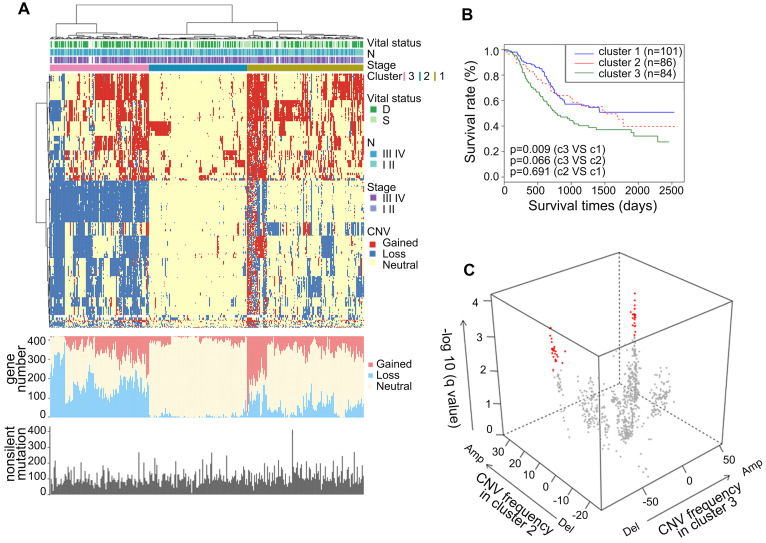
Figure 4.
Somatic copy number alterations analysis in integrated ESCC cohort and characterization of different subtypes. (A) Hierarchical clustering analysis on the CNA of 420 top rank frequent alterations metabolic-related gene. Upper bars: stage, lymphatic metastasis, and vital status. Bottom bars: nonsilent mutations of each sample and number of CNAs. (B) Kaplan-Meier analysis comparing survival of patients stratified by different clusters. (C) Multidimensional scaling screen for metabolic-related genes by comparing subtypes 3 and 2. Genes that q < 0.001 and frequency of copy number gain or loss in subtypes 3 or 2 ≥ 20% were highlighted in red.

