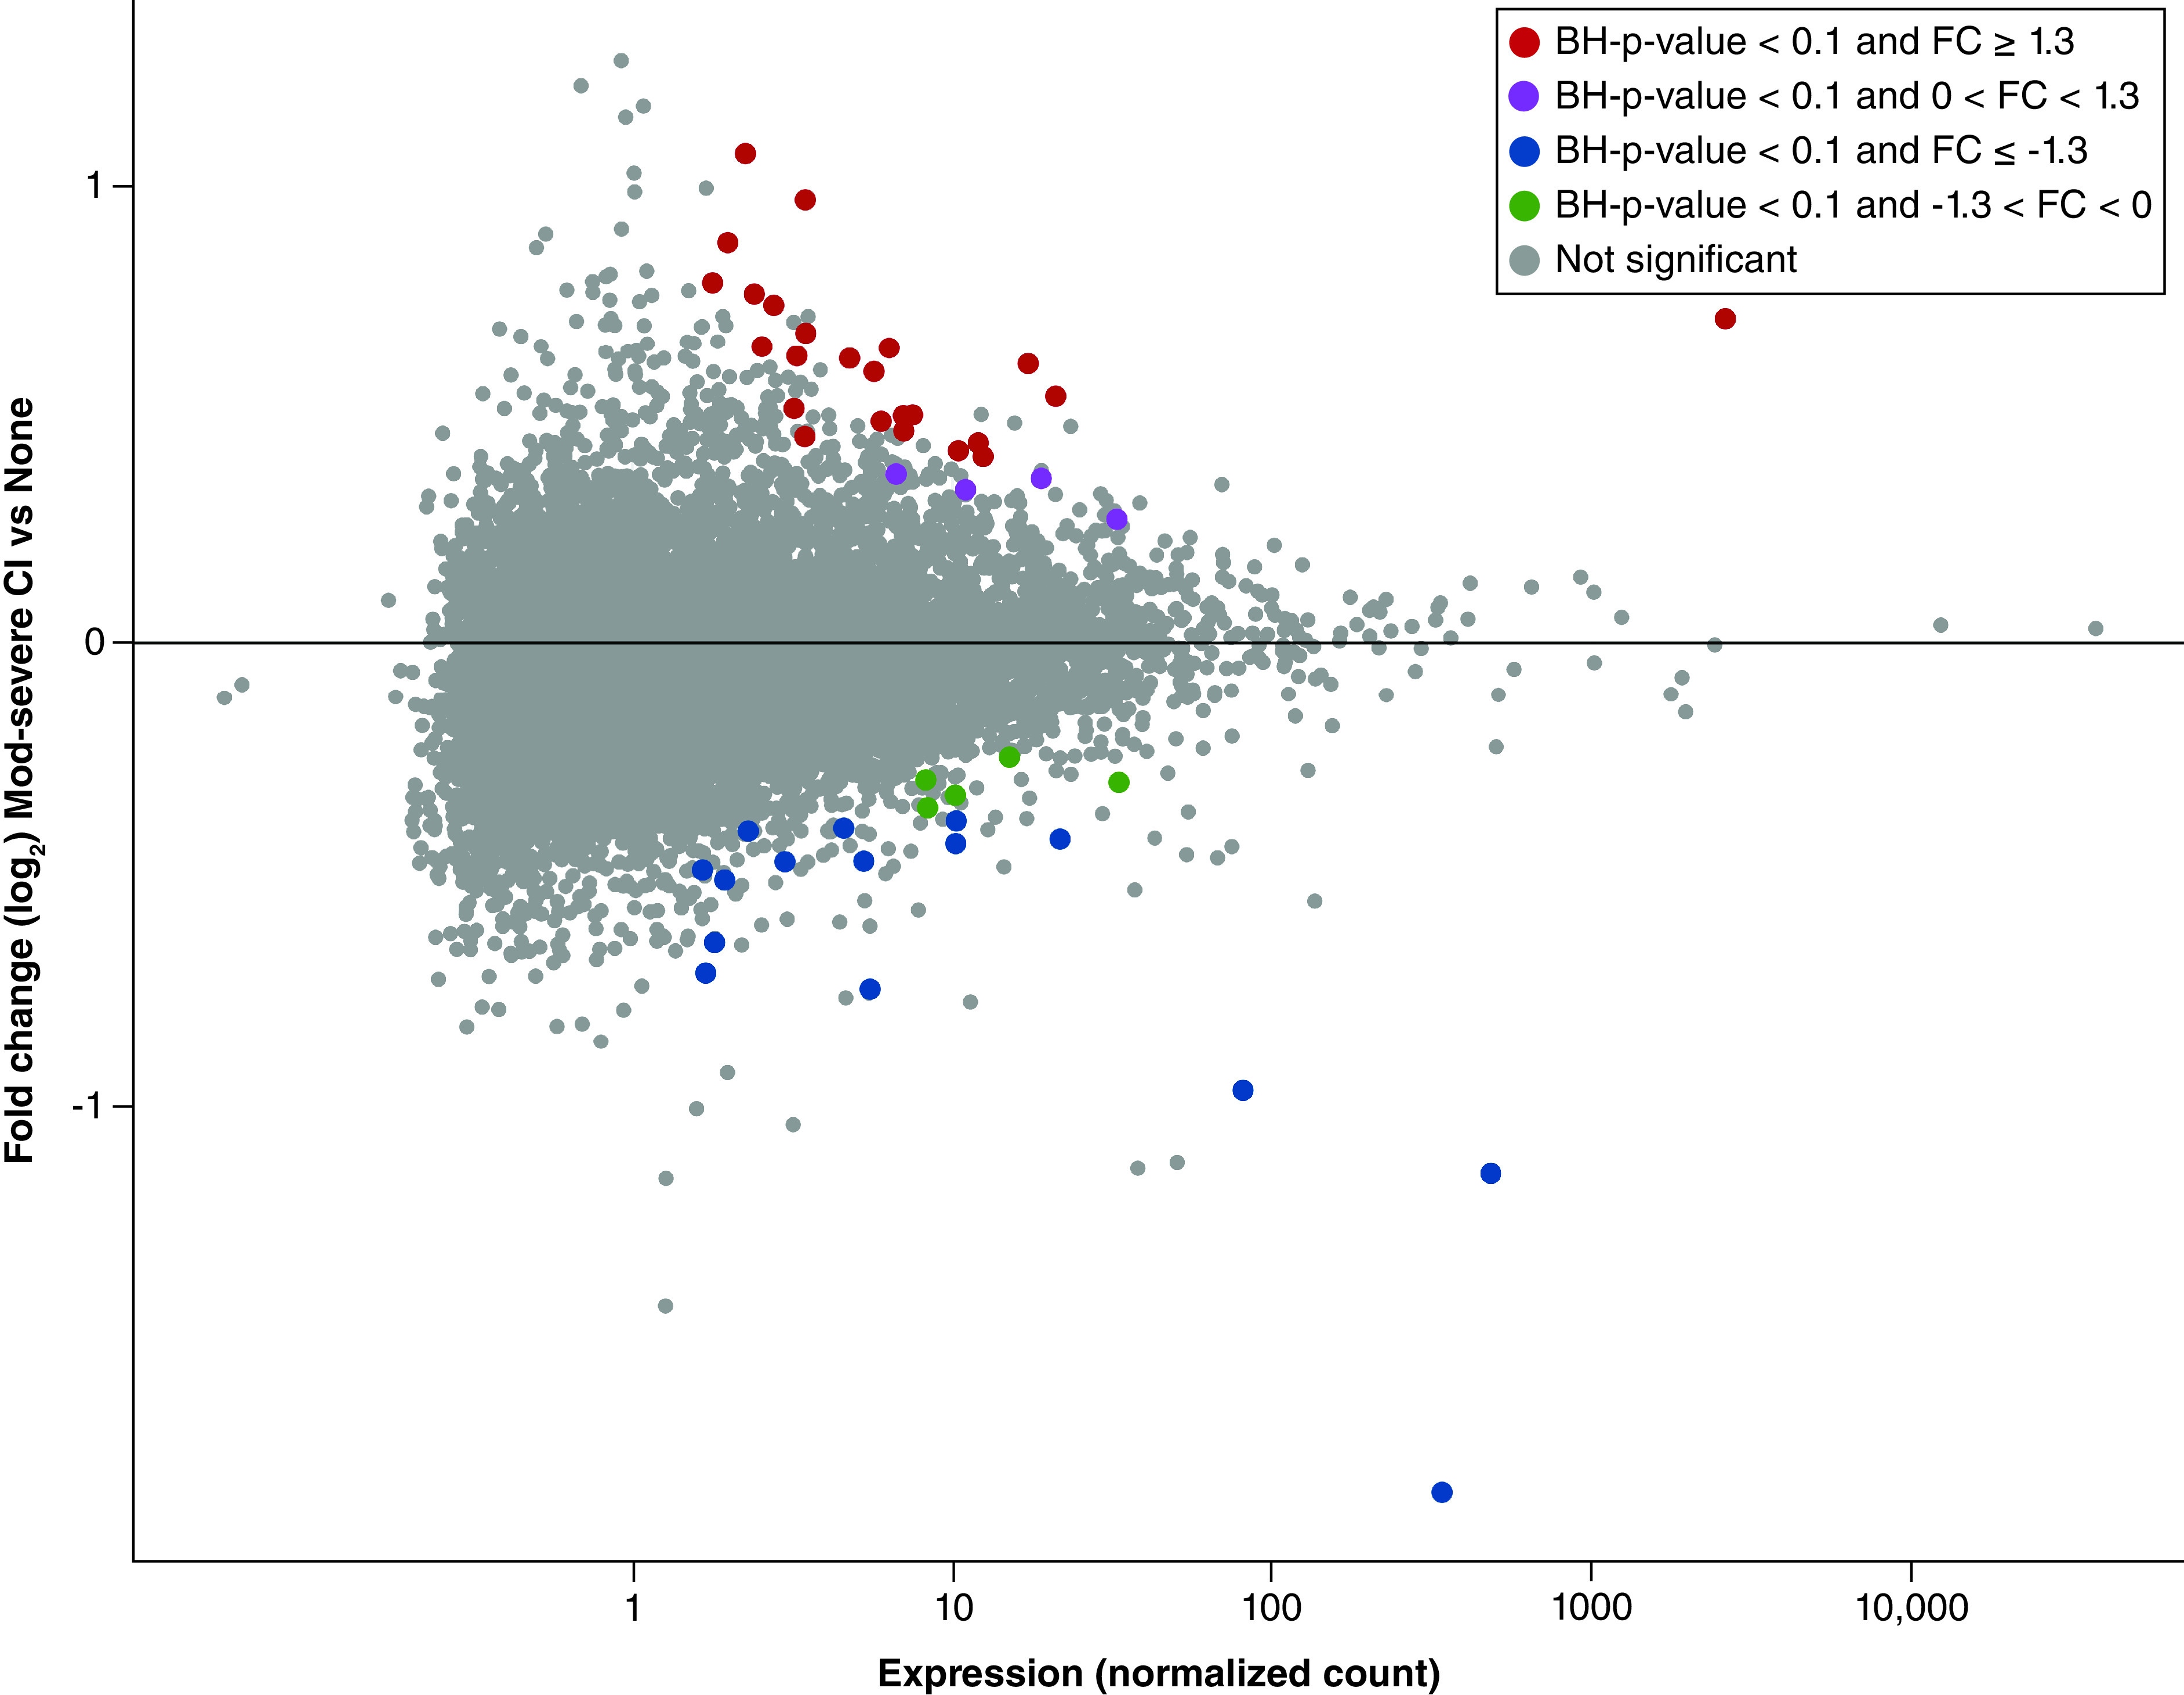
Figure 1. . Distribution of placental mRNAs with significant differential expression associated with impaired neurocognition (n = 48).

MA plots illustrate distributions for those identified in all placentas. Plots display the median normalized mRNA expression levels versus fold change in expression. FC values represent the ratio of mRNA expression in placentas derived from children with impaired neurocognition/normal.
BH: Benjamini-Hochberg; FC: Fold change.
