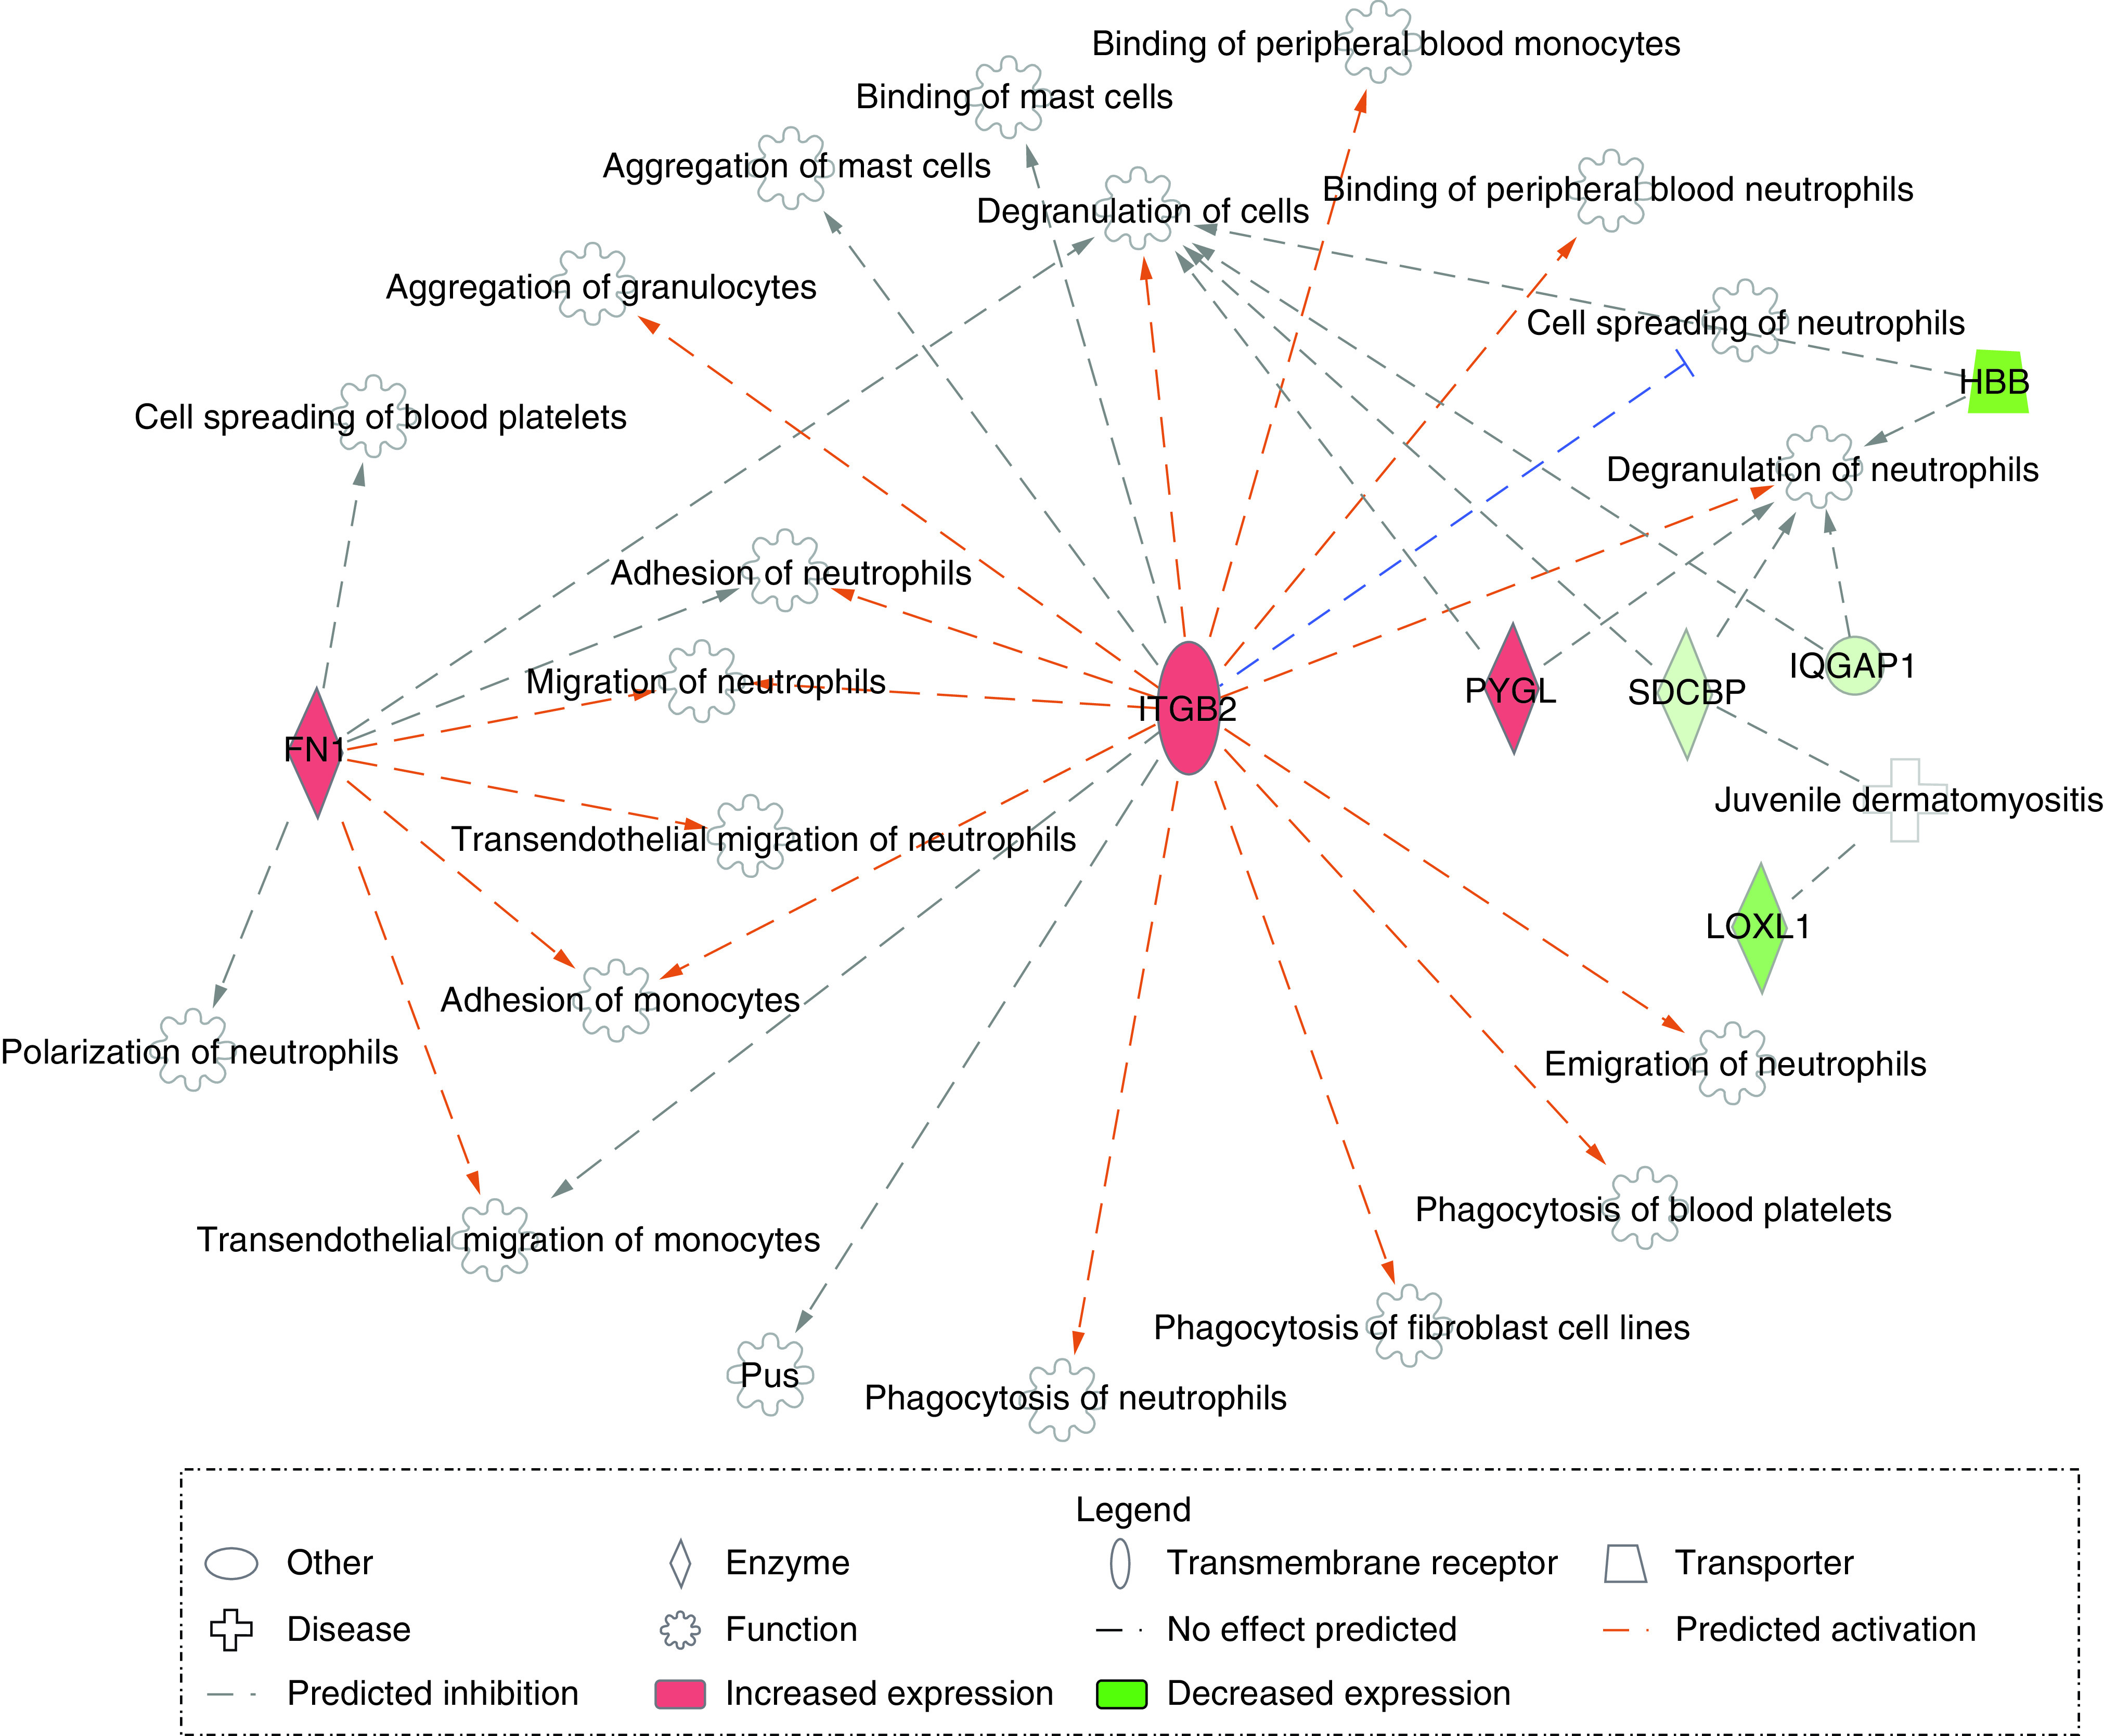
Figure 2. . Pathway of inflammatory response-associated genes.

Genes are indicated in either red (increased predicted expression) or green (decreased predicted expression). Orange is indicative of predicted activation, and blue is indicative of predicted inhibition of the described function. Orange lines predict leads to activation, and blue lines predict leads to inhibition. Gray lines indicate there is no effect predicted.
