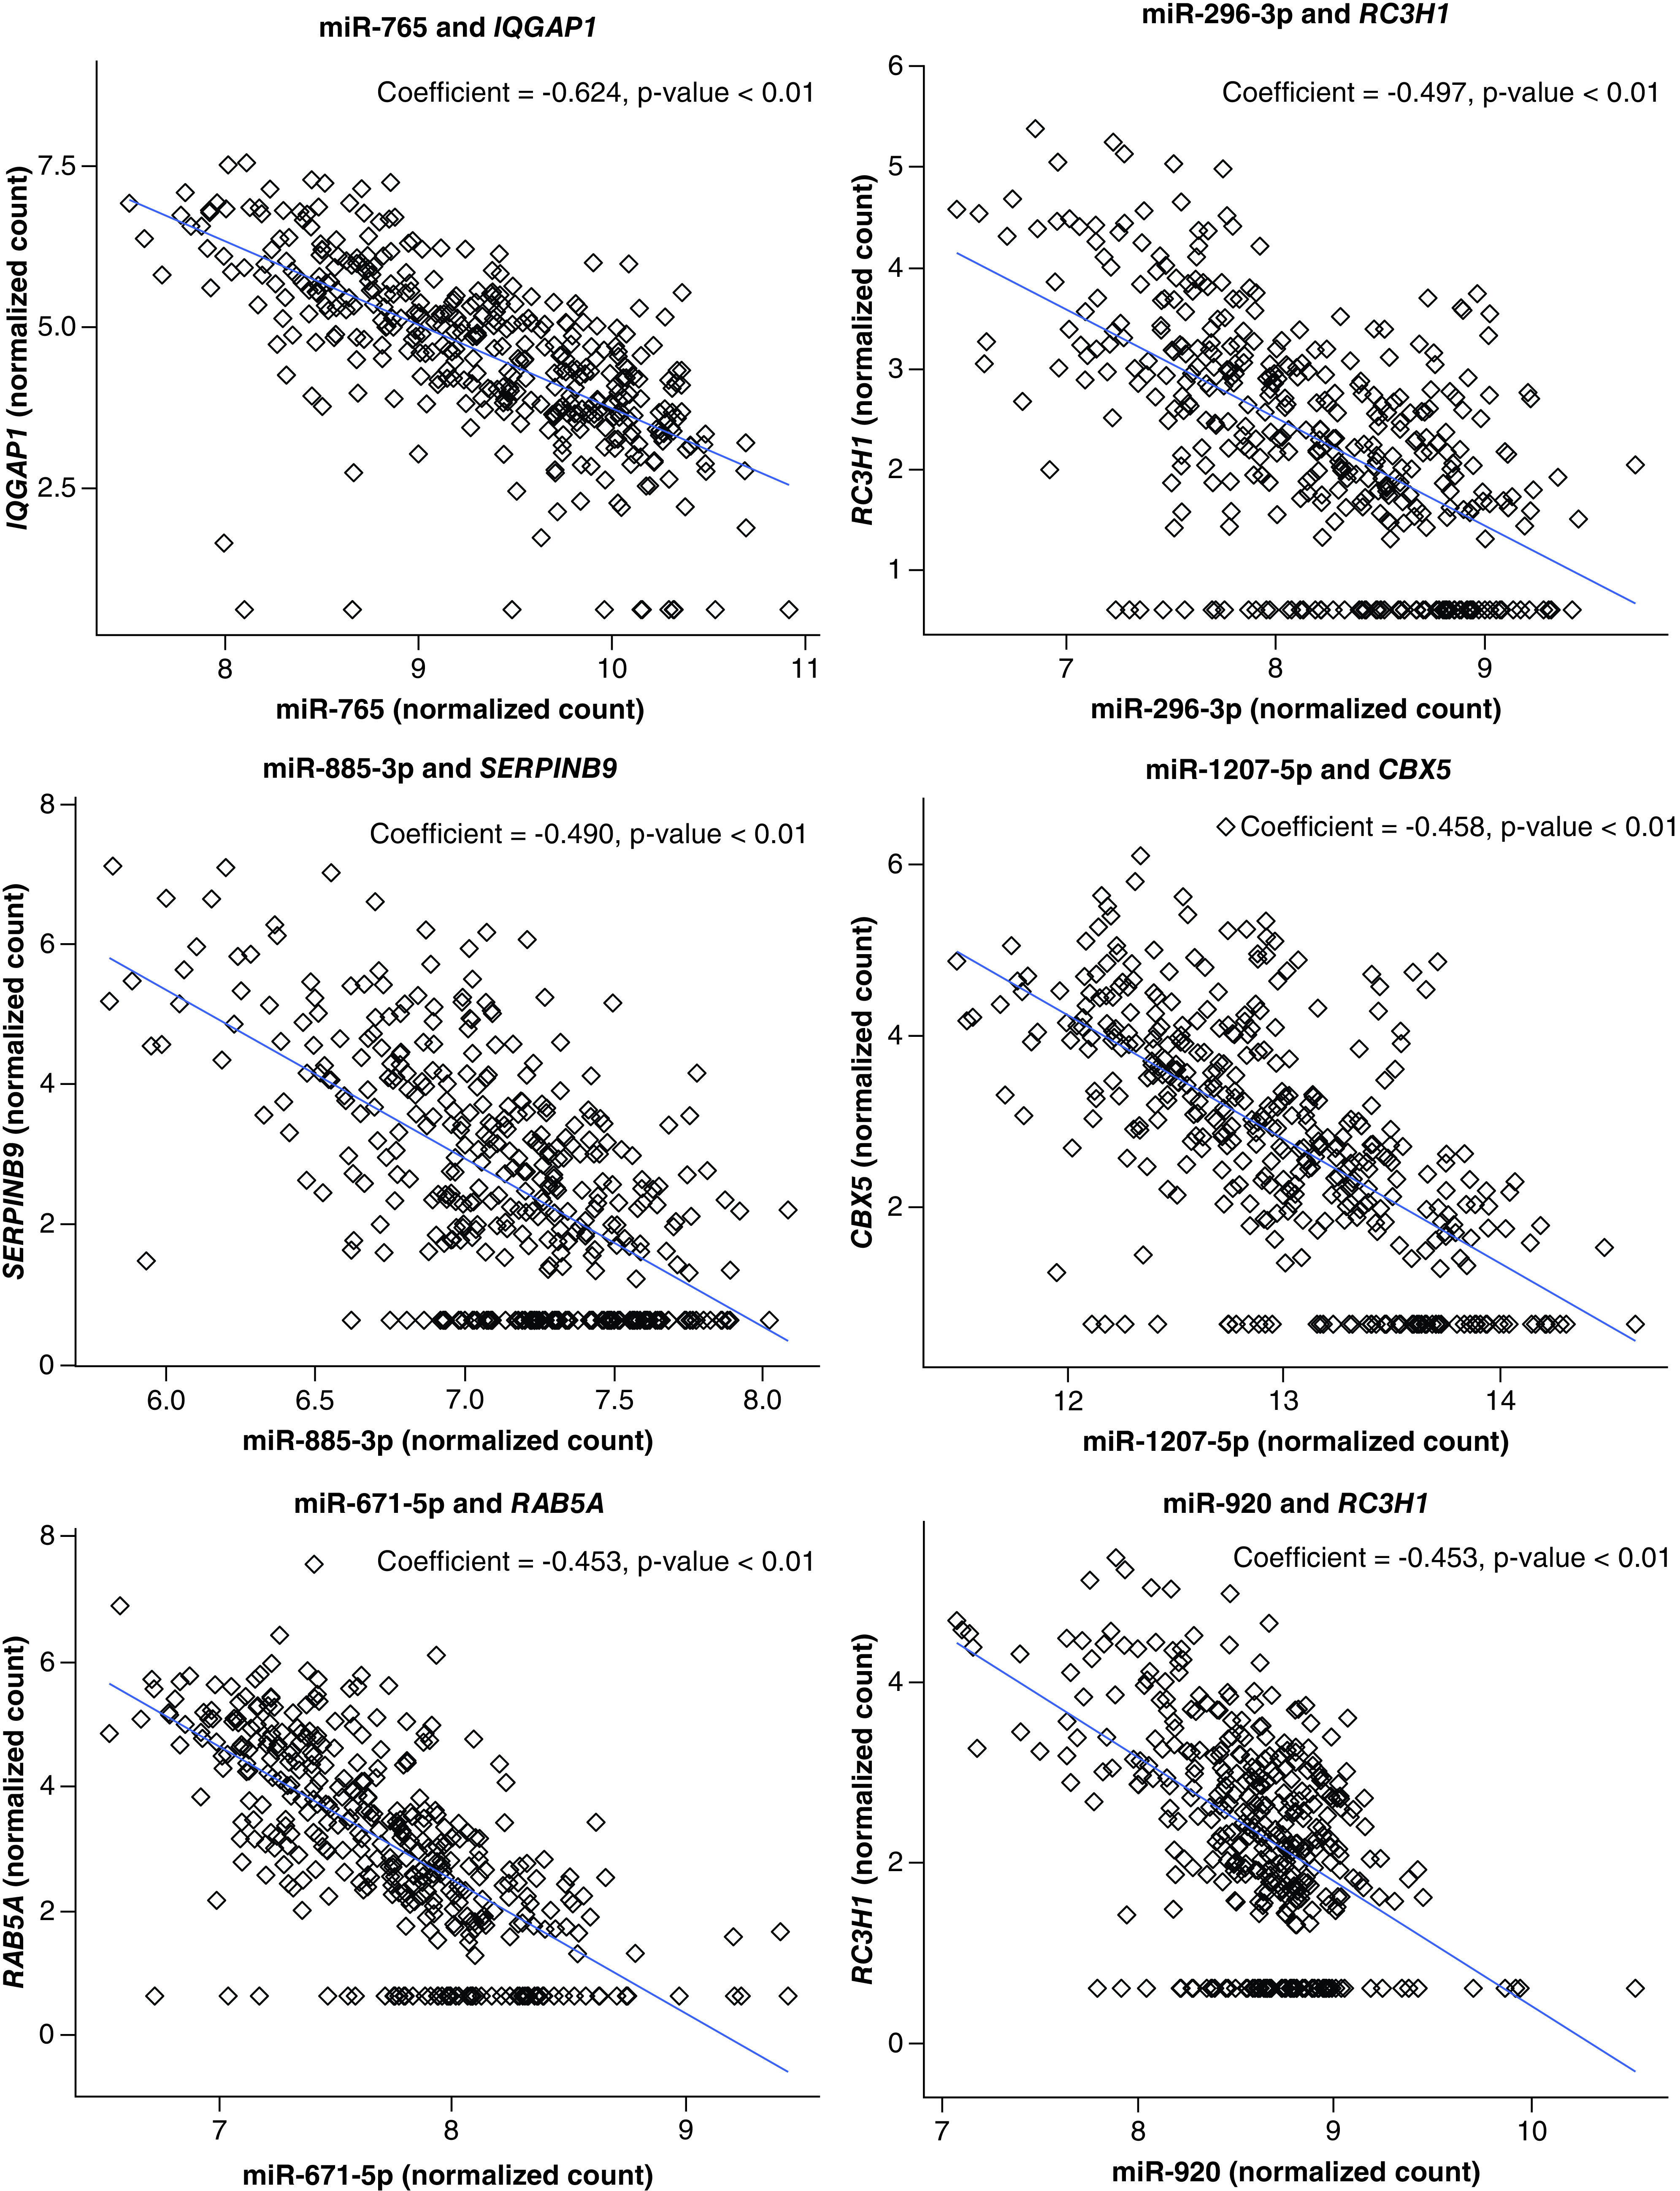
Figure 3. . Six significantly correlated miRNA–mRNA expression pairings.

The x-axis represents the variance stabilized counts (‘normalized count’) of miRNAs. The y-axis reflects variance stabilized counts (‘normalized count’) of mRNAs. Correlation coefficients and p-values are at the top of the plot.
