Figure 2.

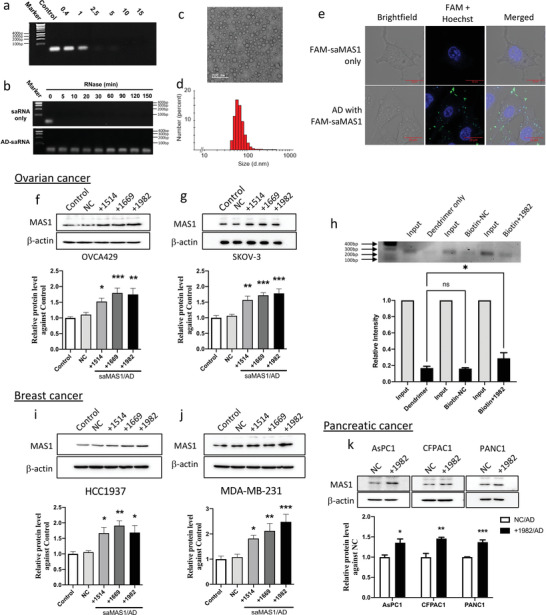
Dendrimer vector AD forms nanoparticles with saRNA and delivers saMAS1 in ovarian, breast, and pancreatic cancer cells for enhancing MAS1 gene expression. a) Agarose gel‐shift analysis suggests the interaction of saMAS1+1982 with AD and complete encapsulation of saRNA at the N/P ratios of ≥2.5. b) The saRNA/AD complexes protect saMAS1+1982 from RNase A digestion. c) TEM imaging and d) DLS analysis of saMAS1+1982/AD complexes at an N/P ratio of 10. e) Confocal fluorescence images of FAM‐labeled saMAS1+1982 demonstrate the delivery of saRNA by AD into SKOV‐3 cells. The cells were treated with FAM‐labeled RNA complexed with AD, then stained with Hoechst 33342 before imaging. Blue: Hoechst 33342; green: FAM‐labeled RNA. f,g) saMAS1/AD increases the MAS1 protein levels in the ovarian cancer cell lines f) OVCA429 and g) SKOV‐3 as evaluated by western blotting. Upper: representative western blot; lower: quantification of protein levels from three experiments. h) The ChIbRP assay confirmed the binding of biotinylated MAS1 saRNA+1982 to the MAS1 gene. Upper: agarose gel image of the PCR product from the input control and the MAS1 chromatin following pull‐down by biotinylated saRNA; lower: the relative levels of PCR products compared to the input control. i,j) Three saMAS1/AD complexes (+1514, +1669, and +1982) enhanced the MAS1 protein levels in breast cancer i) HCC1937 and j) MDA‐MB‐231 cells as determined by western blotting. k) saMAS1+1982/AD enhanced MAS1 protein levels in pancreatic cancer cell lines (AsPC1, CFPAC1, and PANC‐1). All data in this figure are presented as mean ± SEM values from ≥3 experiments. p values are calculated by using one‐way ANOVA with Dunnett correction. An unpaired t‐test was used for two‐group comparisons in (k). Significant differences are indicated (*p < 0.05; **p < 0.01; ***p < 0.001 vs control; ns, not significant).
