
Figure 5.
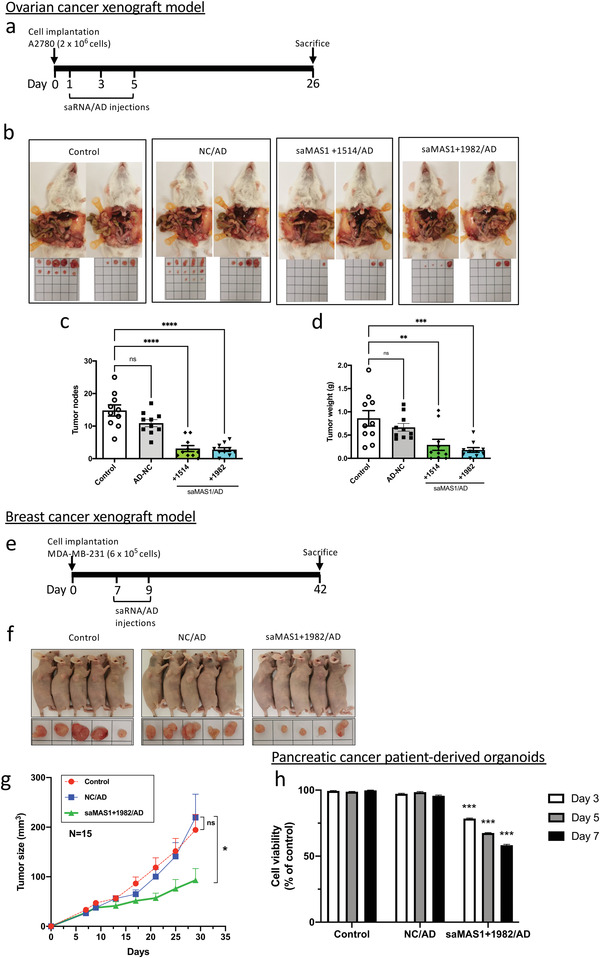
Effects of saMAS1/AD on ovarian and breast cancer xenograft models and patient pancreatic tumor‐derived organoids. a) Timeline showing establishment of a xenograft mouse model using A2780 ovarian cancer cells and the administration of saMAS1/AD to animals. b) Effects of different treatments on the ovarian cancer xenograft model. Administration of saMAS1+1514/AD and saMAS1+1982/AD (saMAS1 at 1.0 mg kg−1 and AD at N/P = 5) greatly reduced the development of A2780‐derived tumors within the peritoneal cavity of mice. Tumors excised from the peritoneal cavity are shown for each group (n = 10). c,d) The number of tumor nodes and the weights of the excised tumors from each group. Significant differences are indicated as **p < 0.01; ***p < 0.001; ****p < 0.0001; ns, not significant versus control. e) Timeline showing establishment of a xenograft mouse model using MDA‐MB‐231 breast cancer cells and administration of saMAS1+1982/AD to animals. f) Effects of different treatments on the breast cancer xenograft model. Administration of saMAS1/AD (saMAS1 at 1.0 mg kg−1 and AD at N/P = 5) greatly reduced the development of MDA‐MB‐231‐derived tumors in xenograft mice. Representative images of the xenograft mice and the excised tumors. g) Tumor size changes in the breast cancer xenograft model (n = 15), *p < 0.05; ns, not significant versus NC/AD. h) Treatment with saMAS1+1982/AD significantly reduces the viability of cells in organoids derived from pancreatic cancer patients. No significant changes were found in the groups treated with NC control RNA. Significant differences are indicated as ***p < 0.001 versus control. All data in this figure are presented as mean ± SEM values. p values are calculated by using one‐way ANOVA with Dunnett correction.