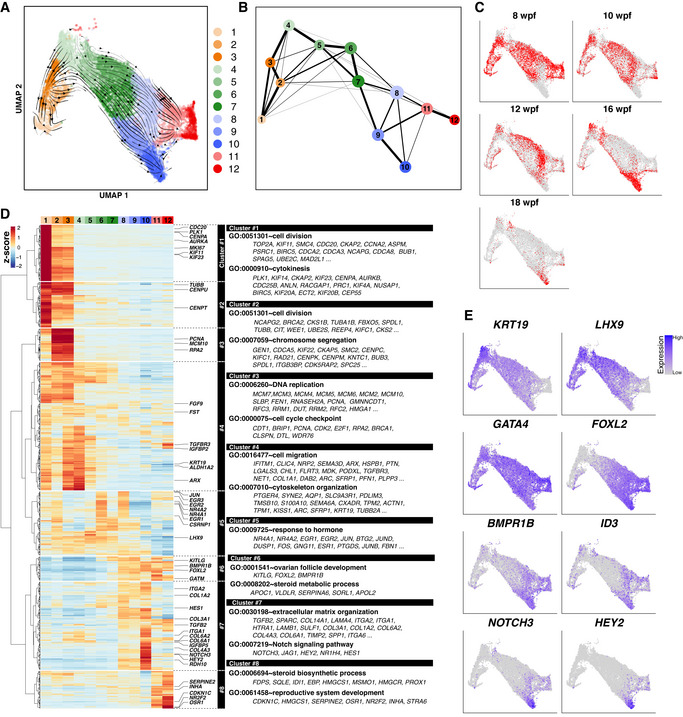
Figure EV4. 10X scRNA‐seq analysis for cy granulosa cells in vivo and in rOvaries.

-
A, BUMAP plot with RNA velocity (A) and PAGA graph (B) of cy in vivo granulosa cells as defined in Fig 4A. Granulosa cells were divided into 12 subclusters by Louvain clustering. The color‐coding is as indicated.
-
CUMAP plot shown in Fig EV4A, highlighting the cells for each fetal stage.
-
D(Left) Heatmap of the standardized expression of HVGs (712 genes) among in vivo cy granulosa‐cell subclusters ordered by UHC; eight gene clusters were defined according to the UHC dendrogram. (Right) Representative genes and key GO enrichments are shown.
-
EFeature plots of key marker genes for cy granulosa‐cell development on the UMAP plot shown in Fig EV4A.
