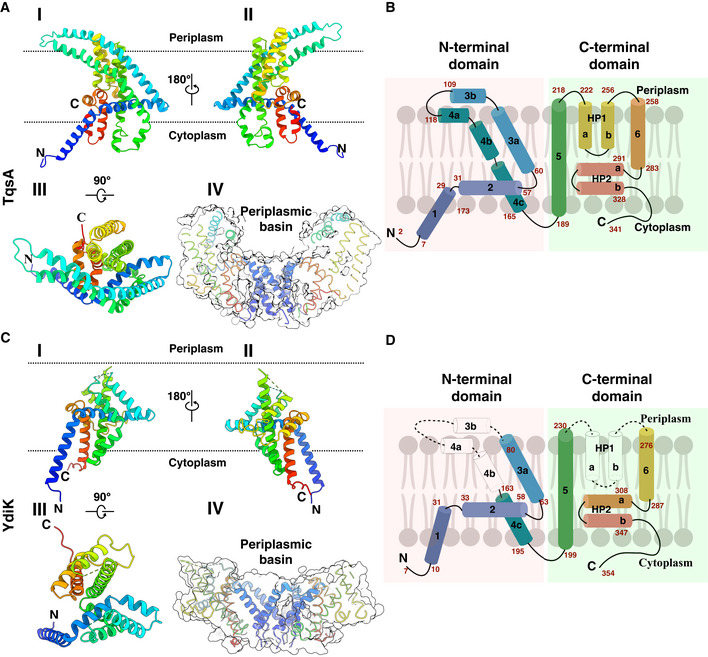
Figure 3. Atomic structures of the two monomeric AI‐2 exporters.

-
ARibbon representation of the TqsA monomer, viewed from the membrane using a rainbow color gradient from the N‐ (blue) to C‐terminus (red). I, II, and III show different orientational views of the monomer. IV represents the sliced surface view of TqsA, highlighting the positioning of H1 and the periplasmic basin.
-
BSchematic representation of the transmembrane topology of TqsA. α‐Helices are shown as cylinders; sequence numbers of amino acids of segments are marked in red. The N‐ and C‐terminal domains are shaded in red and green, respectively.
-
C, DStructure of the YdiK protomer as shown for TqsA in (A) and (B). The hydrophilic part of TM3 and TM4 as well as HP1 are not included in the atomic model due to the weak density for this part in the cryo‐EM map. The missing loops are represented as dashed connecting lines and missing helices are shown as white cylinder in the topology map.
