
Figure EV3. Model fitting of the AI‐2 exporters.
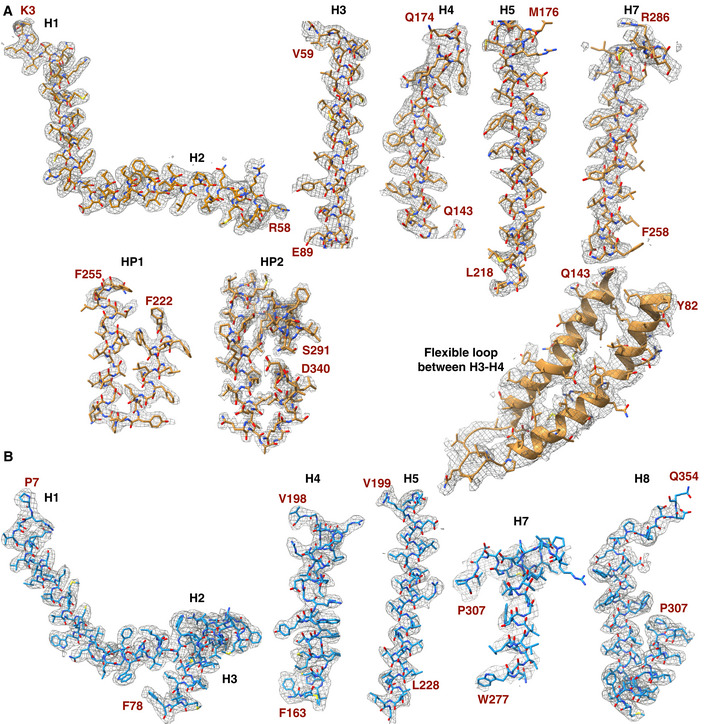
- Model fitting of TqsA in the EM density map for different regions of the monomer structure. The residues constituting a particular structural region are indicated in red.
- Model fitting of YdiK in the EM density map for different regions of the monomer structure is shown with the similar nomenclature as that used for TqsA in A.