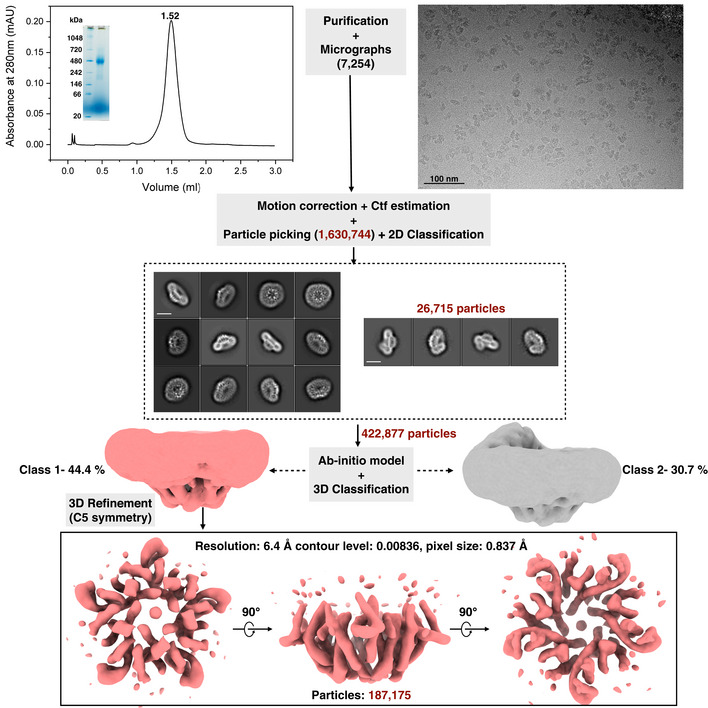
Figure EV4. Cryo‐EM studies on Aq_740 from Aquifex aeolicus .

A flowchart for the entire workflow adopted for Aq_740 is represented in the figure. Analytical SEC and BN–PAGE profile for Aq_740 are shown in the beginning on the top of the figure. Superose 6 3.2/300 GE column analytical column was used for the final size exclusion step. An illustrative raw micrograph for GDN purified AI‐2 exporter Aq_740 from Titan Krios TEM at 300 kV with 0.837 Å pixel size is shown on the right. A total of 7,254 gain‐corrected movies were collected. Reference‐free 2D class averages for Aq_740 (scale bar—10 nm) were obtained from RELION 3.1 with an initial particle stack of around 1,630,744 particles. Later, two different and almost equally populated 3D classes were obtained as shown. One of them depicted in light coral shade was further refined with imposed C5 symmetry. It yielded a low‐resolution 3D reconstruction of 6.40 Å which is shown in different angular views at the bottom of the figure upon anti‐clockwise rotation along the X‐axis. The final particle stack of the map is around 187,175 particles. The processing was performed using C1 symmetry. C5 symmetry was only imposed on the later refinement stage of Class 1.
