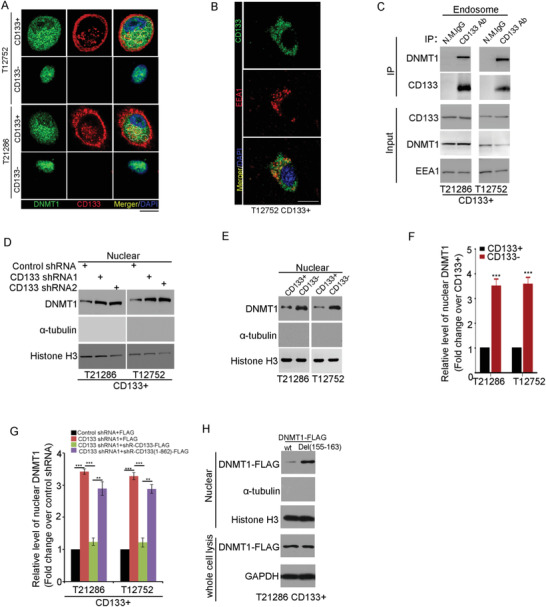
Figure 2.

The CD133–DNMT1 interaction inhibits the nuclear translocation of DNMT1. A) Co‐localization of CD133 and DNMT1 is assessed by immunofluorescence staining of CD133 (red) and DNMT1 (green) in T12752 (upper panel) and T21286 (lower panel) CD133+ cells. Nuclei (blue) are counterstained with DAPI. Co‐localization of CD133 and DNMT1 is demonstrated by yellow fluorescence. The interaction between DNMT1 and cytoplasmic CD133 is indicated by dashed circle. Scale bars, 10 µM. B) Co‐localization of CD133 and EEA1 is assessed by immunofluorescence staining in CD133+ cells. Nuclei (blue) are counterstained with DAPI. Co‐localization of CD133 and EEA1 is demonstrated by yellow fluorescence. Scale bars, 10 µM. C) CD133 interacts with DNMT1 at endosome. Lysates of endosome protein isolated from CD133+ glioma cells are subjected to IP using anti‐CD133 antibody (Clone W6B3C1), followed by IB with anti‐CD133 (Clone W6B3C1) or anti‐DNMT1 antibodies. The efficiency of endosome isolation is checked by EEA1 (endosome marker). D) Nuclear distribution of DNMT1 in CD133+ cells expressing control shRNA, CD133 shRNA1, or CD133 shRNA2 is determined by IB. Histone H3 is used as the nuclear marker, and α‐tubulin is used as the cytosolic marker. E,F) The level of nuclear DNMT1 in CD133+ cells and matched CD133‐ cells is determined by IB. Histone H3 is used as the nuclear marker, and α‐tubulin is used as the cytosolic marker. E. The figures are presented out of three independent experiments. F) The relative densities of DNMT1 to Histone H3 are quantified using densitometry. Values are normalized to that of CD133+ cells. Results are expressed as mean ± SD from three independent experiments; t test, ***p < 0.001, Student's t‐test. G) The level of nuclear DNMT1 in CD133+ cells expressing control shRNA, CD133 shRNA1, CD133 shRNA1 + shRNA‐resistant wild‐type CD133, or CD133 shRNA1 + shRNA‐resistant CD133(1–862) mutant is determined by IB. Histone H3 is used as the nuclear marker, and α‐tubulin is used as the cytosolic marker. The relative densities of DNMT1 to Histone H3 are quantified using densitometry. Values are normalized to that of cells expressing control shRNA. Results are expressed as mean ± SD from three independent experiments; ***p < 0.001, Student's t‐test. H) The level of nuclear DNMT1‐FLAG in CD133+ cells expressing FLAG‐DNMT1 or DNMT1(Del(155–163)) is determined by IB. Histone H3 is used as the nuclear marker, and α‐tubulin is used as the cytosolic marker.
