
Figure 4.
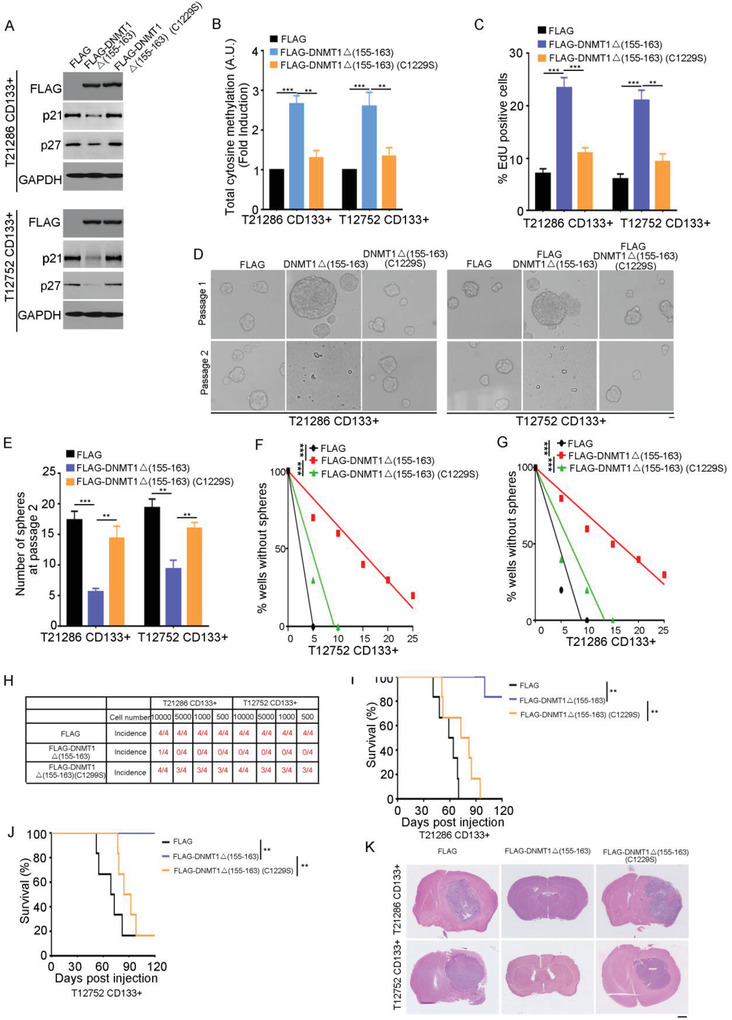
Nuclear localization of DNMT1 inhibits the self‐renewal ability and the tumorigenesis of GSCs. A) Western blot analysis of FLAG‐DNMT1, p21, p27 expression in CD133+ cells expressing FLAG, FLAG‐DNMT1(Del(155–163)), or its C1229S mutant. GAPDH is used as a loading control. B) The level of total 5‐methylcytosine in CD133+ cells expressing FLAG, FLAG‐DNMT1(Del(155–163)) or its C1229S mutant is examined by ELISA kit. Values are normalized to that of cells expressing FLAG. Results are expressed as mean ± SD from three independent experiments; ***p < 0.001, **p < 0.01, Student's t‐test. C) Analysis of 5‐ethynyl‐2′‐deoxyuridine (EdU)‐labeled CD133+ cells expressing FLAG, FLAG‐DNMT1(Del(155–163)) or its C1229S mutant. The percentage of EdU‐positive cells is measured. Results are expressed as mean ± SD from six independent experiments; ***p < 0.001, **p < 0.01, Student's t‐test. D,E) The number of spheres derived from 100 CD133+ cells expressing FLAG, FLAG‐DNMT1(Del(155–163)), or its C1229S mutant at passages 1 and 2. D) Representative images are shown. E) Results are expressed as mean ± SD from three independent experiments; ***p < 0.001, **p < 0.01, Student's t‐test. Scale bar represents 10 µM. F,G) Limiting dilution assay shows overexpression of DNMT1(Del(155–163)) reduced stem cell frequency in T12752 (F) or T21286 (G) CD133+ cells. n = 10, ***p < 0.001 by ELDA analysis. H) The tumor‐initiating capacity of CD133+ cells expressing FLAG, FLAG‐DNMT1(Del(155–163)) or its C1229S mutant. An intracranial limiting dilution tumor formation assay (employing 10000, 5000, 1000, and 500 cells per mouse) is performed using CD133+ cells infected with the indicated lentivirus. The table displays the number of mice developing tumors. I–K) T21286 (I) or T12752 (J) CD133+ cells expressing FLAG, FLAG‐DNMT1(Del(155–163)) or its C1229S mutant are implanted into immunocompromised mice brain (5000 cells per mouse). Mice are sacrificed when they are moribund or 120 days after implantation. I,J) Survival of mice (n = 6) is evaluated by Kaplan‐Meier analysis (**p < 0.01, log rank test). K) H&E staining of mouse brain shows tumors formation by CD133+ cells expressing FLAG, FLAG‐DNMT1(Del(155–163)) or its C1229S mutant. Scale bar, 1 cm. C1229 (Cys at position 1229 ) in the FLAG‐DNMT1 Del(155‐163) protein corresponds to Cys at position 1226 in wild type human DNMT1 protein.