
Figure 8.
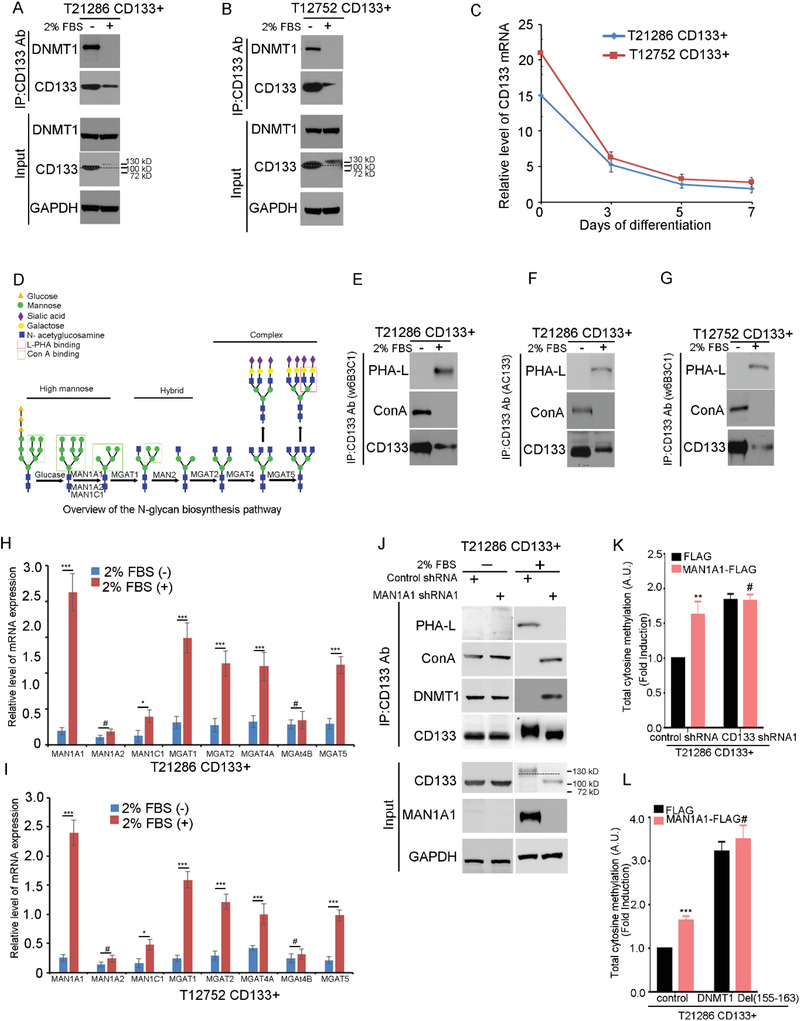
The high‐mannose N‐glycan of CD133 promotes the interaction between CD133 and DNMT1. A,B) The interaction between CD133 and DNMT1 during GSC differentiation is examined by Co‐IP assay. The lysates of T21286 (A) and T12752 (B) CD133+ cells treated with 2% FBS for 7 days are subjected to IP using anti‐CD133 (Clone W6B3C1), followed by IB with anti‐CD133 (Clone W6B3C1) or anti‐DNMT1 antibodies. Whole cell lysates are analyzed by IB with anti‐CD133 (Clone W6B3C1) or anti‐DNMT1 antibodies as input. Dotted line indicates the shift of CD133 molecular weight. A molecular‐weight size marker is shown. C) qRT‐PCR quantification of the mRNA levels of CD133 in CD133+ cells from glioblastoma specimens (T21286 and T12752) after treatment with 2% FBS at different time points. Values are mean ± SD from three independent experiments. D) Overview of the N‐glycan biosynthesis pathway. Relationships between N‐glycans, GlcNAc‐transferases, and plant lectins. The boxed shaded structures are recognized by the plant lectins ConA and PHA‐L. ConA lectin, recognizing high mannose glycans; PHA‐L lectin, recognizing β1,6 branched GlcNAc. E–G) Lectin blot is performed to analyze the structure of CD133 N‐glycan during GSC differentiation. The lysates of T21286 (E,F) and T12752 (G) CD133+ cells treated with 2% FBS for 7 days are subjected to IP using anti‐CD133 (Clone W6B3C1) Ab (E,G) or anti‐CD133 Ab (Clone AC133) Ab (F), followed by IB with anti‐CD133 antibody or biotinylated lectins. H,I) qRT‐PCR analysis of the mRNA levels of MAN1A1, MAN1A2, MAN1C1, MGAT1, MGAT2, MGAT4A, MGAT4B, or MGAT5 in T21286 (H) and T12752 (I) CD133+ cells treated with or without 2% FBS for 7 days. Values are mean ± SD from three independent experiments; ***p < 0.001, **p < 0.01, #, ns. Student's t‐test. J) MAN1A1 regulated the N‐glycosylation of CD133. The lysates of CD133+ cells treated with 2% FBS for 7 days transfected with control shRNA or MAN1A1 shRNA are subjected to IP using anti‐CD133 Ab, followed by IB with anti‐CD133 Ab (Clone W6B3C1), anti‐DNMT1 Ab or biotinylated lectin. Whole cell lysates are analyzed by IB with anti‐CD133 (Clone W6B3C1) Ab, anti‐DNMT1 Ab, or anti‐MAN1A1 Ab as input. GAPDH is used as a loading control. Dotted line indicates the shift of CD133 molecular weight. A molecular‐weight size marker is shown. K) The level of total 5‐methylcytosine in CD133+ cells expressing control shRNA, or CD133 shRNA1 and FLAG or MAN1A1‐FLAG is examined by ELISA kit. Values are normalized to that of CD133+ cells. Results are expressed as mean ± SD from three independent experiments; **p < 0.01, #, ns. Student's t‐test. L) The level of total 5‐methylcytosine in CD133+ cells expressing FLAG, or MAN1A1‐FLAG and control or DNMT1(Del(155–163)) is examined by ELISA kit. Values are normalized to that of CD133+ cells. Results are expressed as mean ± SD from three independent experiments; ***p < 0.001, #, ns. Student's t‐test.