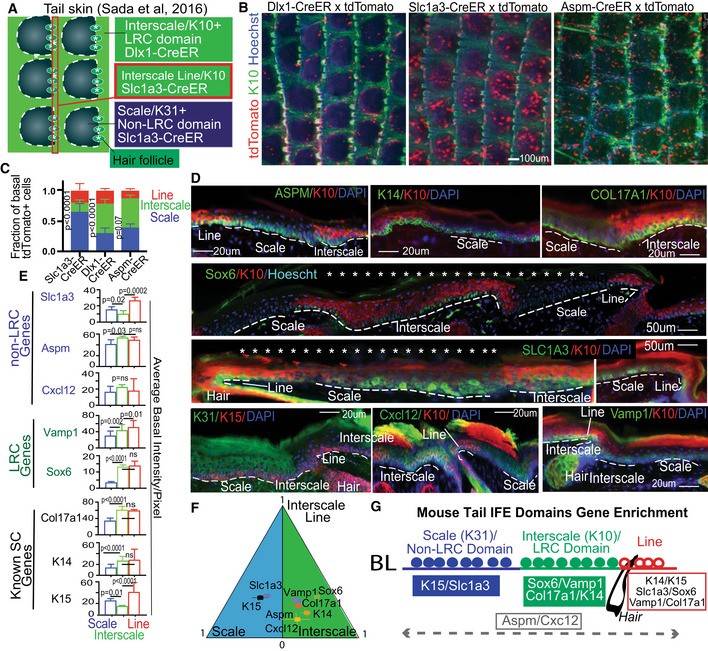
Figure 1. Basal layer cells express different LRC/non‐LRC preferred‐genes in scales vs. interscales of mouse tail skin.

-
AModel of tail skin organization in IFE domains.
-
B, C(B) Whole mount low magnification images show marking in interscale (K10+) vs. scale regions, quantified in (C). Error bars are SDs. The data shown are average of four different time points (2 week, 3 month, 6 month and 1 year) each consisting of two mice and five images per mice. P‐value is calculated for difference between scale vs. interscale using Student's t‐test (mixed Anova).
-
DTail skin sections immunofluorescence stained for interscale (K10) or scale (K31) supra‐basal markers, and basal markers. Scale bar = 20 μm or 50 μm as indicated on the panels. Asterisks indicate that photoshop was used to erase the autoflourescent cornified layer. Dashed lines indicate ROI in basement membrane.
-
EQuantification of images like those in (D) with n = 3–4 mice and 6–7 images per mouse showing preferred‐gene enrichment. Error bars are SDs. P‐values calculated by Student's t‐test (mixed effect model).
- F
-
GCartoon summarizing spatial distribution of markers in the tail IFE domains.
