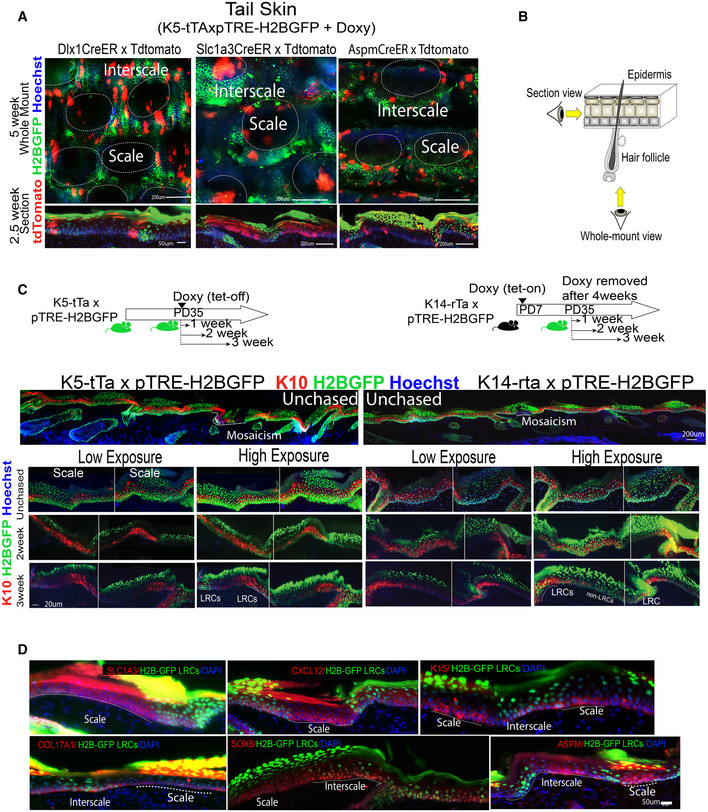
Figure EV1. H2B‐GFP LRC and non‐LRC IFE domains in mouse tail skin from lineage‐traced mice (Associated with Fig 1).

-
AWhole mount view (top) and sections (bottom) of mouse tail skin from Dlx1‐/Slc1a3‐/AspmCreER x K5‐tTA/pTRE‐H2BGFP mice showing H2BGFP label retaining cells (LRCs) after doxycycline (doxy) chases. Scale bar = 50 or 200 μm as indicated on panels. Interscales regions have been previously shown enriched in LRCs (Mascre et al, 2012; Gomez et al, 2013; Sada et al, 2016). Here, scale and interscale regions are tentatively outlined based on the known H2B‐GFP LRC clustering, the 3‐hair follicle grouping patterns and DAPI staining.
-
BCartoon showing the microscopic view for whole mount and sections.
-
CTop Panels: Schematics of tet‐off (left) versus tet‐on (right) inductions used for comparison with (Piedrafita et al, 2020). Bottom Panels: Tail skin sections from K5‐tta x and K14‐rta x pTRE‐H2BGFP mice stained with interscale (K10) marker (as indicated). “Mosaicism” denotes areas of the IFE devoid of H2BGFP due to deficiency in transgene expression. High vs. low exposure images demonstrate enrichment of LRCs in the interscale areas in both mouse models. Better contrast is obtained in the K5‐tTa (our preferred) mouse model compared to the K14‐rTa (Piedrafita et al, 2020) and a minimum of 2‐week chase is required to note differences.
-
DTail skin sections stained for LRC/non‐LRC markers as in Fig 1D, exhibit preferred overlap with H2BGFP LRC or non‐LRCs IFE domains. Dotted lines indicate scale or interscale, depending on which is written within the image.
Source data are available online for this figure.
