
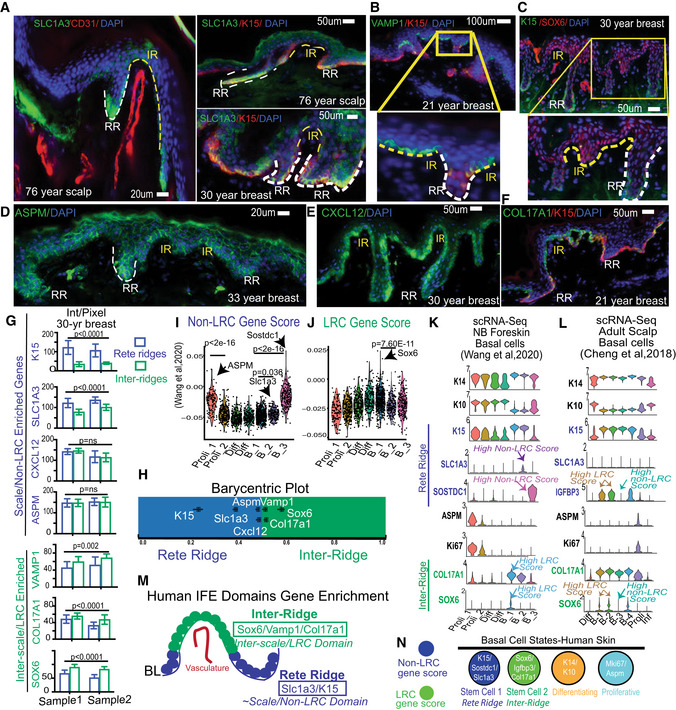
Figure 2. Human IFE shows basal domains and cell clusters enriched in mouse LRC/non‐LRC preferred‐genes.
-
A–FHuman skin immunofluorescence images of mouse basal non‐LRC/LRC preferred‐factor staining in rete ridges (RR) versus inter‐ridges (IR). Representative images from 30 samples of different body regions and ages (see Appendix Table S1). Scale bars are indicated on the panels.
-
GLRC/non‐LRC preferred gene expression in RR and IR samples from two 30‐year‐old breast samples, quantified using background subtraction (Materials and Methods). P‐values from paired Student's t‐test. Error bars are SDs. 8–10 images were quantified each from two females.
-
HRelative RR vs. IR gene expression/area normalized to sum to one, shown as barycentric plot. A gene expressed only in inter‐ridges would be plotted at 1. Error bars are SEMs.
-
I, JGene score analysis in cell clusters from (Wang et al, 2020). P‐values from pairwise Wilcoxon rank‐sum tests with Benjamini‐Hochberg correction.
-
K, LscRNA‐seq identified clusters show specific gene expression of relevant markers.
-
MCartoon summarizing differential RR vs. IR marker distribution.
-
NModel of human IFE basal cell states with LRC/ non‐LRC gene expression distributions.