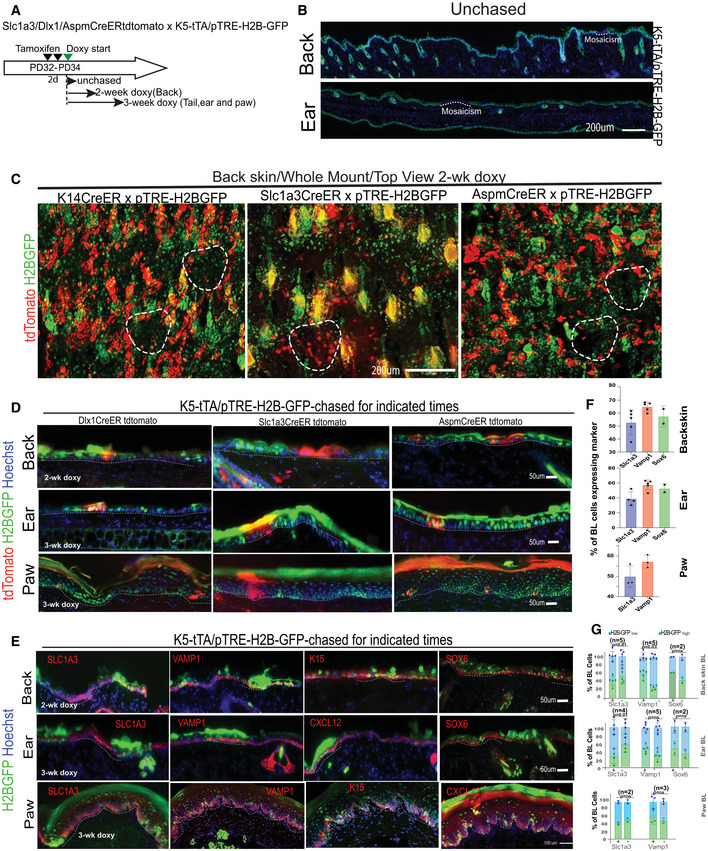
Figure EV2. H2B‐GFP LRC and non‐LRC IFE domains in mouse non‐tail body regions from lineage‐traced mice (Associated with Fig 1).

-
ASchematic of tamoxifen and doxy chase times for various body skin regions.
-
BBack and ear skin sections from unchased K5‐tTA x pTRE‐H2BGFP mice. Mosaicism is due to deficiency in transgene expression in ear skin. Scale bars = 200 μm.
-
C, DWhole mount (C) and section (D) view of back from lineage‐traced mice showing 2‐week chased H2B‐GFP (green) postinjection with high tamoxifen (TM) dose. Scale bars = 200 μm (C) or as indicated (D). Dashed line in (C) indicates non‐LRC patches devoid of H2BGFP signal. Dotted lines in (D) indicated basement membrane.
-
EImages of skin from back, ear and paw immuno‐stained for some markers from Fig 1D. Dotted lines in (E) indicates ROI in basement membrane. Scale bar is as indicated per row.
-
F, G(F) Quantification of images like those in (E) with n = 2–5 mice and 6–7 images per mouse showing marker heterogeneity and (G) overlap with H2BGFP LRCs vs. non‐LRCs domains. P‐values were calculated by two‐tail Student's t‐test.
Source data are available online for this figure.
