
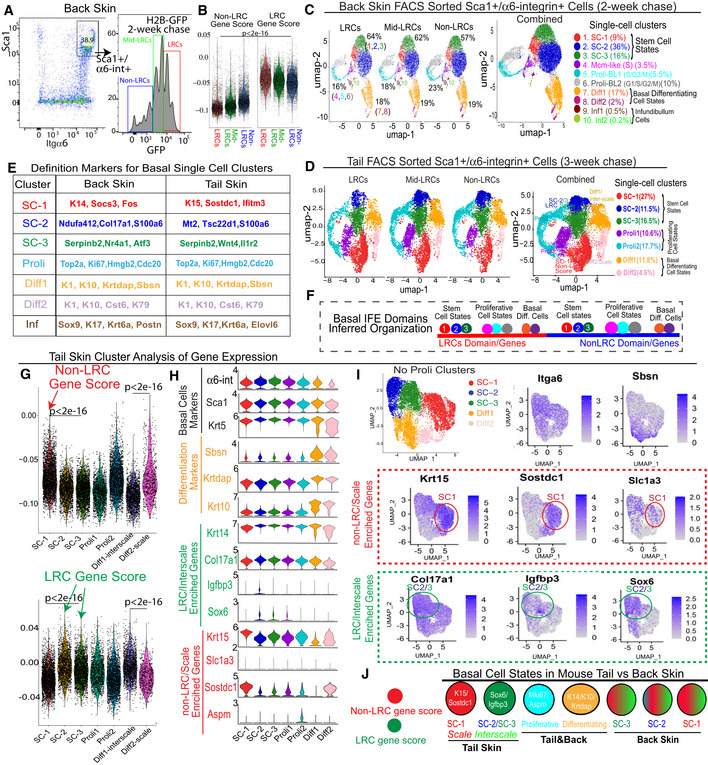
Figure 3. Single‐cell RNA‐seq of basal IFE LRCs/non‐LRCs sorted from mouse back and tail skin.
-
AFACS sorting of basal LRCs, mid‐LRCs and non‐LRCs.
-
BscRNA‐seq data of sorted cells from (A) analyzed for LRC/non‐LRC gene scores computed from microarray data (Sada et al, 2016).
- C, D
-
EBasal cluster definition markers.
-
FModel of basal IFE domain cell states.
-
GLRCs and non‐LRCs computed gene scores are differentially enriched in tail SC clusters. P‐values from pairwise Wilcoxon rank‐sum tests with Benjamini‐Hochberg correction.
-
H, IViolin and feature plots of markers in tail skin without proliferative (Proli) clusters. Note LRC/interscale markers Sox6&Igfbp3 enriched in SC‐2&3 and non‐LRC/scale markers K15/Sostdc1 enriched in SC‐1. Slc1a3 is in SC‐1 (scale); SC‐2 expression is likely due to Slc1a3 expression in interscale line.
-
JModel of LRC/non‐LRC gene scores and marker expression in scRNA‐seq clusters found in tail vs. back skin.