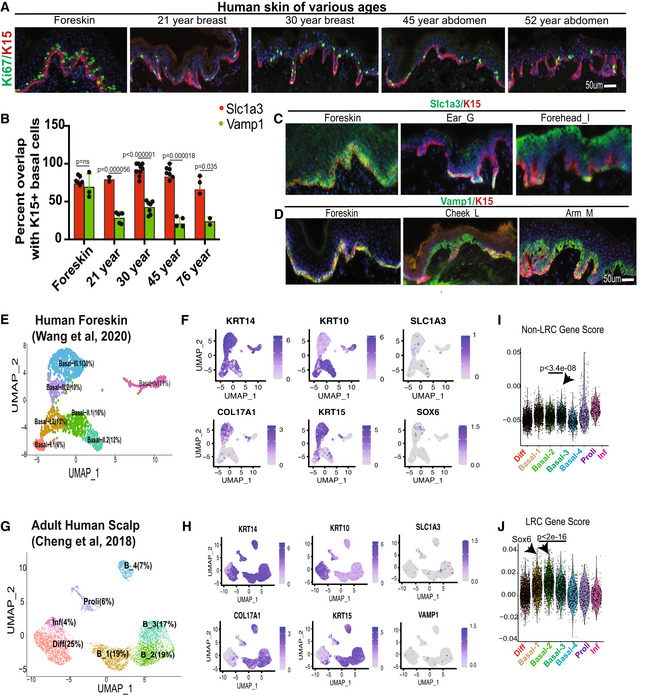
Figure EV4. Human skin LRC/non‐LRC marker staining and scRNA‐seq analysis (Associated with Fig 2).

-
AKi67 staining of human skin at various ages. Scale = 50 μm for all the panels.
-
BQuantification demonstrates preferential colocalization of K15 with Slc1a3 (non‐LRC/scale marker), but not with Vamp1 (LRC/interscale marker) in human skin of all ages, except in newborn foreskin. Error bars are SDs. 2–9 images were quantified from two different samples at every age. P‐values were calculated by two‐tailed Student's t‐test.
-
C, DExamples of staining in newborn foreskin and other adult body regions suggests more pronounced heterogeneity in the adult. Scale = 50 μm for all the panels.
-
E–H(E, G) Seurat generated clusters from scRNA‐seq extracted from indicated studies shown as UMAP plots. (F, H) Feature plots show expression of specific markers in clusters from (E) and (G), respectively.
-
I, JNon‐LRC and LRC gene enrichment score analysis in cell clusters from (Cheng et al, 2018). P‐values were calculated using pairwise Wilcoxon rank‐sum tests with Benjamini‐Hochberg correction.
Source data are available online for this figure.
