
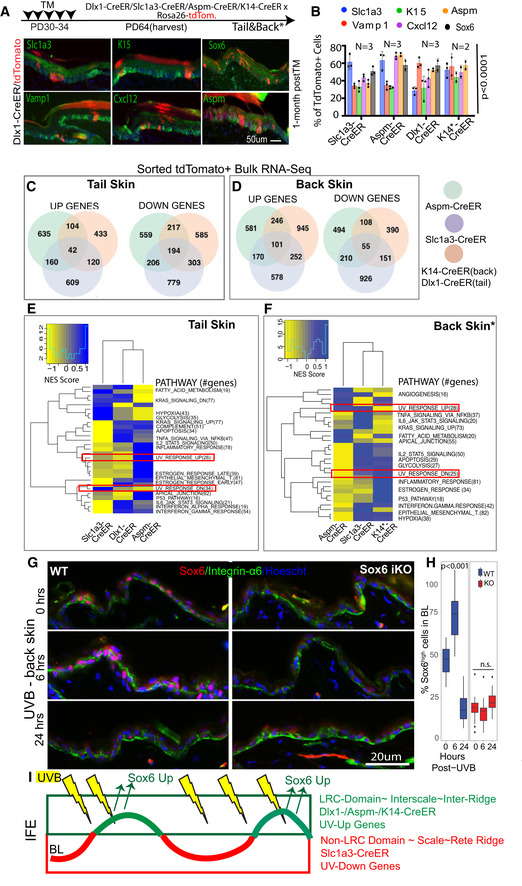
Figure 5. Molecular differences in IFE populations suggest domain‐specific adaptation to environmental UV exposure.
-
ASchematic showing the tamoxifen injection paradigm for tdTomato‐labeling of all IFE lineages in tail and back. Co‐expression of markers with the lineage‐traced cells at 1‐month post‐tamoxifen. Dlx1‐CrER is shown as example in tail; see also Appendix Fig S2A and C (*Back skin). Scale bar = 50 μm.
-
BQuantification of images like those in (A) and Appendix Fig S2A, showing % tdTomato+ cells expressing indicated markers. Sox6 (black bar) was not analyzed in K14‐Cre/EYFP lineage. See also Appendix Fig S2B for scale vs. interscale split. Error bars are SDs. P‐values calculated by Student's t‐test (mixed effects model) from n = 2–3 mice and 5–6 images per replicate.
-
C–F(C, D) Venn diagram showing bulk RNA‐seq data in the three sorted IFE basal lineages and (E, F) heatmap for their differentially regulated Hallmark_Pathways.
-
GImmunofluorescence images of Sox6 staining in noUVB (0 h) or UVB‐exposed (6 h‐ or 24‐h post) mouse back skin.
-
HBoxplot shows % Sox6 expressing basal cells quantified from images like those in (G). Central band is the mean value, the top of box indicates 25th percentile while the bottom indicates 75th percentile. Whiskers indicate minimum and maximum values in the data, with dots indicating potential outliers. Linear mixed model statistical test was used with data from 18 images from 3 biological replicates.
-
IModel of IFE LRC/non‐LRC domains and marked lineages with distinct degree of UV exposure in normal conditions.