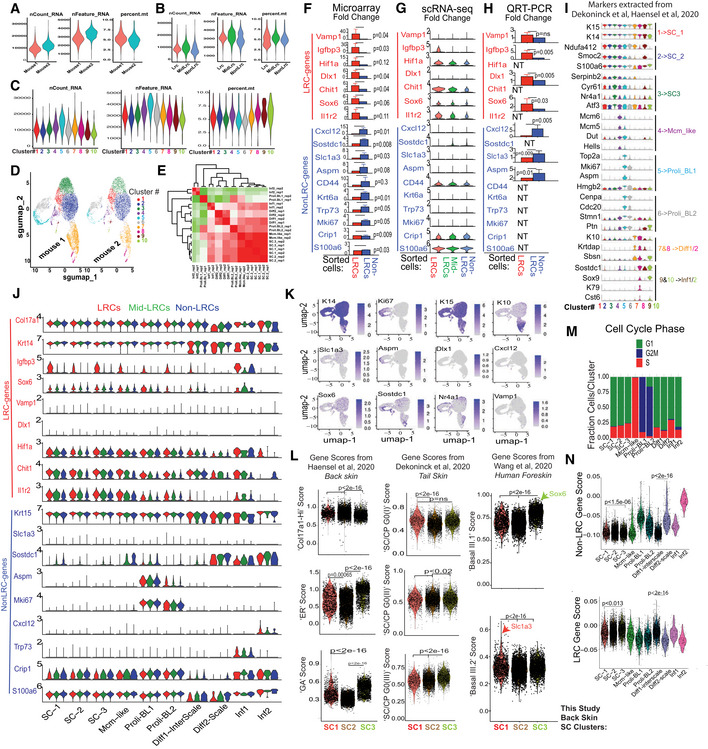
Figure EV5. Mouse back skin scRNA‐seq of sorted basal LRCs, Mid‐LRCs, Non‐LRCs (Associated with Figs 3 and 4).

-
A–C(A) mRNA or gene count and percent mitochondrial genes reflecting the quality of selected cells used for scRNA‐seq analysis are shown as violin plots for the (A) two mouse replicates and (B) three sorted IFE cell samples and (C) ten clusters used in our scRNA‐seq experiment.
-
D, EHigh correlation between UMAP plots (D) and clusters in gene expression matrix (E) from the two mouse replicates.
-
F–HGene expression changes in sorted basal cells from microarray (Sada et al, 2016) (F), scRNA‐seq (G) and qRT‐PCR (H); SEM and P‐values are indicated. N = 3 in (F), two mice in (G) and 4–5 mice (NT is not tested) in (H). Note low or undetectable levels of many markers in (G). Two‐tailed Student's t‐test.
- I
-
JViolin plot representation for the LRC/non‐LRC marker expression in the given clusters across the samples showing generally low expression or weak differences in clusters.
-
KFeature plots of cluster‐defining markers and LRC/non‐LRC genes.
-
LScores extracted from previous publication as indicated (Dekoninck et al, 2020; Haensel et al, 2020; Wang et al, 2020) demonstrate correlations among our 3 SC populations with the other databases (Dataset EV1). P‐value was calculated using pairwise Wilcoxon rank‐sum tests with Benjamini‐Hochberg correction.
-
MCell cycle scoring of cells in various clusters as defined by cell‐cycle phase‐specific gene lists using Addmodulescore (see Materials and Methods) function in Seurat.
-
NLRCs and non‐LRCs gene scores from previous microarray of back skin (Sada et al, 2016) detect both gene sets in all single‐cell derived clusters with some enrichment. P‐value was calculated using pairwise Wilcoxon rank‐sum tests with Benjamini‐Hochberg correction.
Source data are available online for this figure.
