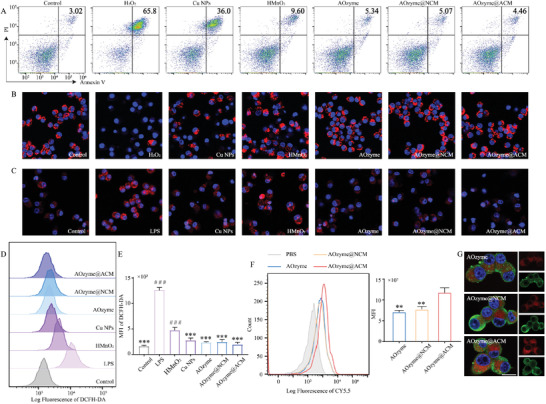
Figure 2.

Multienzyme‐like antioxidative activity of AOzyme@ACM in vitro. A) Representative flow cytometry plots assessed by Annexin V and propidium iodide (PI) double‐staining of cell apoptosis distribution of Raw264.7 cells under different treatment condition with exogenous H2O2 (500 µm) stimulated or not. B) The mitochondrial transmembrane potential (red) of Raw264.7 cells under different treatment condition with exogenous H2O2 (500 µm) stimulated or not was observed by CLSM. C) Representative images of O2 •− staining (red) of Raw264.7 cells under different treatment conditions. D) Representative flow cytometry histograms and E) mean fluorescence intensity (MFI) analysis of ROS production by Raw264.7 cells under different treatment condition with LPS (100 ng mL−1) stimulated or not. F) Flow diagrams with MFI analysis and G) CLSM images of Raw264.7 (stained with β‐actin (green)) incubated with Cy5.5 (red) labeled NPs for 60 min. Scale bar, 10 µm. Data are presented as mean ± SD (n = 3). **p < 0.01 and ***p < 0.001 versus LPS. ### p < 0.001 versus AOzyme@ACM (one‐way ANOVA with Bonferroni post hoc test).
