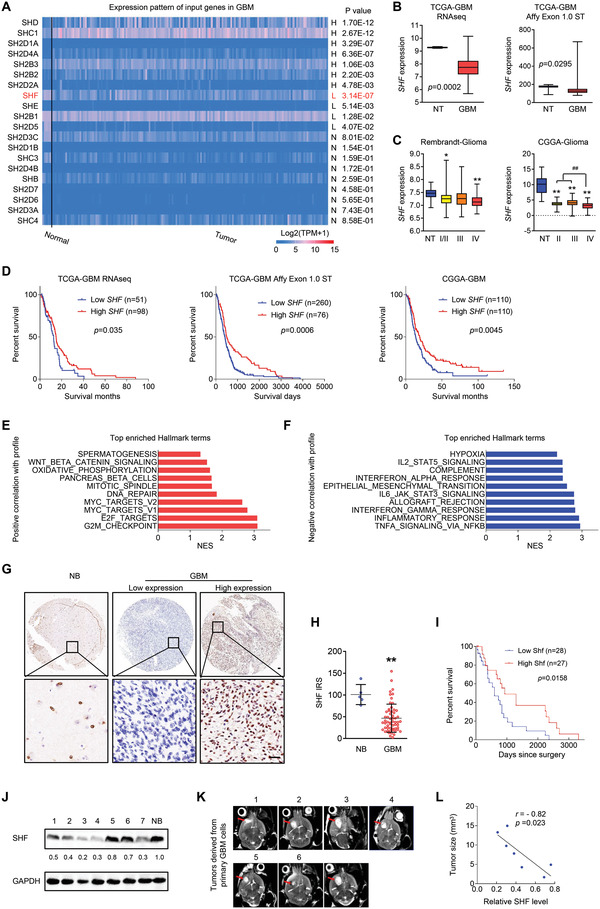
Figure 1.

SHF downregulation is associated with tumorigenesis and predicts poor patient prognosis in GBM. A) Comparison of transcript levels of genes coding the SH2 domain‐containing protein between normal and GBM brains according to the TCGA‐GBM dataset (http://ualcan.path.uab.edu). B) Statistical analysis of SHF mRNA expression between non‐tumor brain tissues (NT) and GBMs in TCGA‐GBM datasets (Student's t‐test). C) Statistical analysis of SHF mRNA expression across different grades of gliomas derived from the indicated datasets (*p < 0.05, **p < 0.01, two‐tailed Student's t‐test). D) Overall survival analysis based on SHF mRNA expression in the indicated GBM datasets (Kaplan–Meier survival test). E–F) The top enriched hallmark gene categories identified by GenePattern. NES value of 1.0 and NOM p < 0.05 were used as visual thresholds. G) Immunohistochemical (IHC) analysis of SHF protein expression in a tissue array containing normal brains (NB) and primary GBM tissues. Bars, 50 µm. H) SHF protein was frequently decreased in GBM compared with normal brains (**p < 0.01, Student's t‐test). I) Overall survival analysis based on SHF expression in GBM tissues. Groups were ranked according to SHF IHC scores. The median expression of SHF was used as a cutoff (Log‐rank χ2 = 5.823, P = 0.0158). J) Western blot assay of SHF expression in 3D‐cultured cells derived from primary GBM tissues. GAPDH served as a loading control. The relative expression of SHF is listed. K) Representative MRI images of intracranial xenografts derived from 3D‐cultured cells. Red arrows indicate tumors. L) The correlation analysis between SHF expression and tumor size. (p‐ and r‐value indicated, Spearman's correlation analysis).
