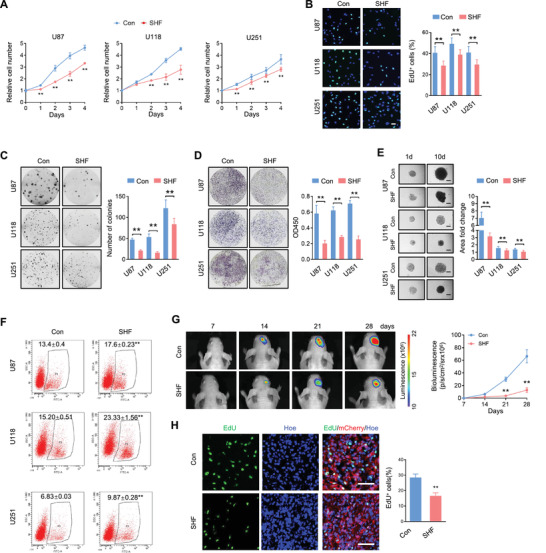
Figure 2.

SHF suppresses proliferation, invasion, tumor sphere growth and increases chemosensitivity of GBM cells. A) Proliferation of indicated cells expressing SHF (SHF) or control vectors (Con) as detected by CCK8 assay (n = 6, Student's t‐test, **p < 0.01). B) EdU‐labeling assay detecting the DNA replication of the indicated cells (n = 6, Student's t‐test, **p < 0.01). Data was expressed as the percentage of EdU positive cells (Green) to total cells indicated by Hoechst labeling (Blue). C) Colony formation of control cells or ectopic SHF expressing cells (left) and the accompanying statistical analysis (right; n = 6, Student's t‐test, **p < 0.01). D) Transwell invasion assay of the indicated cells (left) and the statistical analysis (right; n = 6, Student's t‐test, **p < 0.01). E) 3D‐tumor spheroids growth was recorded (left) and quantitatively analyzed (right; n = 12, **p < 0.01, Student's t‐test). Bars, 200 µm. F) Annexin V staining flow cytometry assay of cells treated with Dox (2 µm) for 48 h (n = 4, Student's t‐test, **p < 0.01). G) Bioluminescent images of intracranial xenografts derived from the implantation of the indicated cells (left) and tumor volume statistical analysis (right; n = 7, Student's t‐test, **p < 0.01). H) Representative immunofluorescence (IF) images of xenograft tumor sections with EdU and mCherry (left) and the statistic of the fraction of EdU‐positive cells (right). Positive cells were quantified 20 randomly selected fields per mouse (n = 7, Student's t‐test, **p < 0.01). Scale bars, 50 µm.
