
Figure 2.
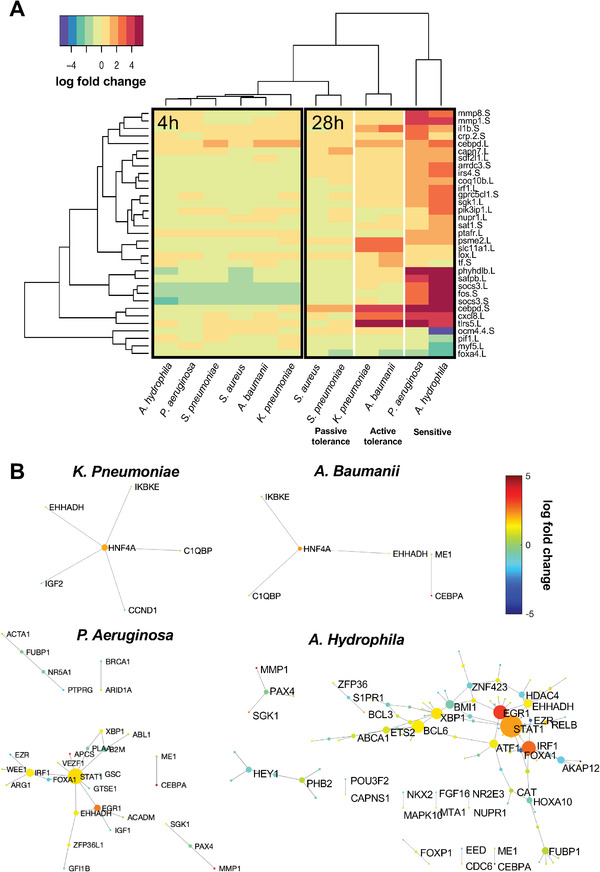
Gene expression analysis stratifies active tolerance to gram negative bacteria and passive tolerance to gram positive organisms. A) Heatmap comparing the expression of 33 genes that undergo significant changes in gene expression relative to uninfected controls at matching time points (p adj < 10−4), with the color scale representing fold change between the infected and uninfected state. Hierarchical clustering analysis reveals that infection begins as a generic infection response at 4 h postinfection and at 28 h transitions to a state of active tolerance against the gram negative bacteria, with A. baumanii and K. pneumoniae stimulating substantial gene upregulation with fold change greater than 2 (gram negative tolerance). In contrast, S. aureus and S. pneumoniae infection resulted in only minor changes in gene expression (gram positive tolerance). B) Gram negative tolerance and susceptible states are characterized by the activation of gene–gene subnetworks, whereas no subnetwork activation was observed in the gram positive tolerance states. Genes within these networks undergo significant changes in gene expression (p adj < 0.05) and edges are defined by known interactions as defined by the TRRUST and KEGG databases. Gene node size corresponds to that gene's degree of interconnectedness with other genes in the network. Gene node color designates the fold change in gene expression.