Abstract
Objective.
The effectiveness of deep brain stimulation (DBS) depends on electrode placement accuracy, which can be compromised by brain shift during surgery. While there have been efforts in assessing the impact of electrode misplacement due to brain shift using preop- and postop-imaging data, such analysis using preop- and intraop-imaging data via biophysical modeling has not been conducted. This work presents a preliminary study that applies a multi-physics analysis framework using finite element biomechanical and bioelectric models to examine the impact of realistic intraoperative shift on neural pathways determined by tractography.
Approach.
The study examined six patients who had undergone interventional magnetic resonance-guided DBS surgery. The modeling framework utilized a biomechanical approach to update preoperative MR to reflect shift-induced anatomical changes. Using this anatomically deformed image and its undeformed counterpart, bioelectric effects from shifting electrode leads could be simulated and neural activation differences were approximated. Specifically, for each configuration, volume of tissue activation was computed and subsequently used for tractography estimation. Total tract volume and overlapping volume with motor regions as well as connectivity profile were compared. In addition, volumetric overlap between different fiber bundles among configurations was computed and correlated to estimated shift.
Main results.
The study found deformation-induced differences in tract volume, motor region overlap, and connectivity behavior, suggesting the impact of shift. There is a strong correlation (R = −0.83) between shift from intended target and intended neural pathway recruitment, where at threshold of ~2.94 mm, intended recruitment completely degrades. The determined threshold is consistent with and provides quantitative support to prior observations and literature that deviations of 2–3 mm are detrimental.
Significance.
The findings support and advance prior studies and understanding to illustrate the need to account for shift in DBS and the potentiality of computational modeling for estimating influence of shift on neural activation.
Keywords: brain shift, computational modeling, deep brain stimulation, neurosurgery, tractography
1. Introduction
Deep brain stimulation (DBS) presents an adjustable and reversible surgical treatment option for symptom relief in patients with movement disorders. One particularly impactful application of DBS is the treatment of Parkinson’s disease (PD), especially those with medically refractory tremor (Collins et al 2010). PD impacts 0.1%–0.2% of the population and 1% of the population over the age of 60 (Bratsos et al 2018). While there is a wealth of literature reports illustrating the effectiveness of DBS therapy, in a comprehensive recent review by Bratsos et al, eight randomized controlled trials were analyzed comparing outcome measures between DBS and best medical therapy (Bratsos et al 2018). Overall the study found in a total of 1189 patients (with sample sizes ranging 19–366 in eight different studies), DBS was determined to significantly improve the total Unified Parkinson’s Disease Rating Scale, including all sub-scores (I–IV), as well as Parkinson’s Disease Questionnaire while decrease levodopa equivalent dose (Bratsos et al 2018). While highly effective in providing better motor control and functionality for patients, the quality of DBS therapy may be compromised, i.e. dissatisfactory outcome or adverse events, by misplacement of DBS electrodes.
To probe the scope of the impact of suboptimal electrode placement on surgical outcome, Rolston et al performed an analysis to examine data on over 28 000 cases of DBS procedures from the Centers for Medicare and Medicaid Services (CMS) and the National Surgical Quality Improvement Program (NSQIP) databases, and reported that revision or removal occurred in 15.2% and 34.0% from CMS and NSQIP, respectively (Rolston et al 2016). The study speculated that ~48.5% of these revisions or removals was likely due to poor positioning of the electrode or inadequate clinical outcome and noted that this result is similar to previous analyses on failed DBS treatment where 46% of revisions were due to suboptimal placement of electrodes (Rolston et al 2016).
One contributing factor to the misplacement of electrodes is brain shift that ensues after burr hole and dural opening in DBS surgery. In a report by Luo et al (2020), a summary of various studies using preop- and postop-imaging data to gauge shift in DBS was provided, where shift at deep brain structures ranges from 1.5 to up to 4 mm. For example, Elias et al found anterior commissure shift above 2 mm in 7.6% of patients and above 1.5 mm in 13.6% (n = 66) (Elias et al 2007). When preop- and intraop-imaging data were used to assess brain shift, Ivan et al found deep brain structure shift above 2 mm in 9% of the study population and 1–2 mm in 20% (n = 44); additionally, cortical surface shift up to 10 mm was observed (Ivan et al 2014). From Elias et al and Ivan et al, it is apparent that brain shift during DBS burr hole surgery occurs in a considerable population of patients (Elias et al 2007, Ivan et al 2014). Addressing brain shift may reduce the incidents of revision or removal due to poorly positioned electrodes as stated in Rolston et al (2016), which would lead to better patient experience, reduce further potential surgical risk, enhance short- and long- term therapy outcome, and improve overall and longitudinal cost-effectiveness of DBS therapy. To date, the deviation threshold from an intended target has been based on clinical observations and speculations, and varies among studies as summarized in Luo et al (2020): e.g. 3 mm is mentioned in Balachandran et al, Anderson et al and McClelland et al; while 2 mm is suggested in Ivan et al and Kremer et al (McClelland et al 2005, Balachandran et al 2009, Ivan et al 2014, Anderson et al 2018, Kremer et al 2019). Developing a computational model based on soft tissue mechanics and bioelectric transport to estimate modulation effect changes would be highly desirable.
There are several groups that have developed sophisticated computational bioelectric models to better understand the biophysics of neuromodulation, where the models compute (a) tractography due to volume of tissue activation (VTA); and/or (b) activation of specific fiber pathways (Butson et al 2007, Chaturvedi et al 2010, Astrom et al 2015).
A few studies have attempted to examine and address the impact of brain shift on tractography. In Choi et al, shift was measured by anatomical control points using preop- and postop-imaging data in subcallosal cingulate DBS surgeries; the impact of electrode displacement was analyzed and found to alter pathway activation patterns (Choi et al 2018). In Horn et al outlining a DBS post-processing pipeline named Lead-DBS, brain shift correction capability was introduced to account for the misalignment between preop- and postop-imaging data (Horn et al 2019).
While these efforts to understand and/or correct for the impact of brain shift on potential treatment outcome are encouraging advances, these studies represented analyses that employed shift measurements from preop- and postop-imaging data. This study aims to advance the understanding of the effect of electrode misplacement with realistic intraoperative shift derived from the gold standard measurement provided by interventional magnetic resonance (iMR). Specifically, the impact of brain shift on functional response predicted by tractography via neural pathway recruitment is assessed. To achieve, the work presented here utilizes a multi-physics analysis framework, i.e. biomechanical and bioelectric finite element (FE) models. Subsequently this analysis framework is applied to six patients who had undergone iMR-guided DBS procedures. Based on the preliminary framework first reported in Luo et al (2019), the methodology in this study has been expanded and then employed to analyze a six-case series of patients that experienced significant intraoperative brain shift during DBS implant.
The objective of this study is to provide qualitative and quantitative support linking the effects of shift-induced electrode misplacement to the degradation of targeted neural pathway recruitment. The work also provides valuable theoretical support toward a critical target deviation threshold whereby treatment quality significantly degrades. Lastly, the work establishes the potential utility and power of multi-physics modeling frameworks to help guide DBS treatments in the presence of intraoperative brain deformations.
2. Methodology
2.1. Overview
The overall analysis framework used for the study is shown in figure 1, which consists of a multi-physics patient-specific biomechanical and bioelectric FE models.
Figure 1.
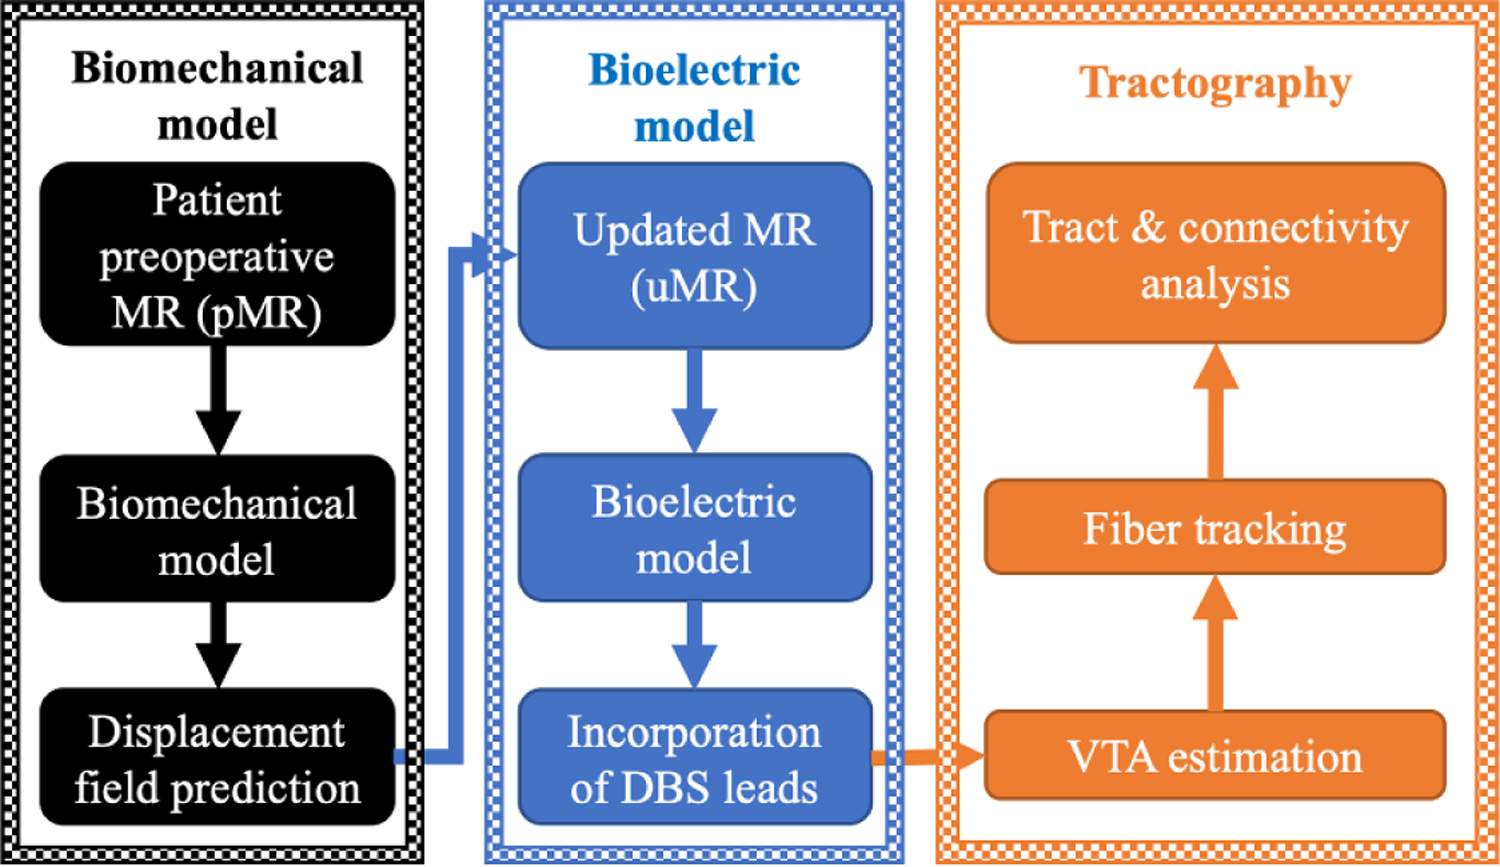
A predictive multi-physics FE modeling framework for brain shift prediction via biomechanical model (left—black block), electric potential computation via bioelectric model (middle—blue block), with subsequent analysis of VTA estimation and tractography (right—orange block).
The biomechanical model (black block in figure 1) aims to provide realistic data-driven intraoperative brain shift predictions from intracranial changes in soft tissue mechanics due to burr hole and dural opening during DBS surgery. Specifically, a sparse-data constrained biomechanical model is used to estimate volumetric shift to better reflect intraoperative patient neuroanatomy. During surgery, the deployment of such model could allow for the accurate mapping of preoperative MR (pMR) targets to intraoperative physical space in the form of patient updated MR (uMR) to improve surgical navigation and targeting.
The bioelectric model (blue blocks in figure 1) aims to provide the spatial distribution of electric potential due to neuromodulation with and without shift adjustment.
Subsequently, VTA and associated neural pathway recruitment via tractography (orange block in figure 1) can be estimated and employed to establish a better understanding for functional impact of DBS therapy as well as potentially degrading events such as brain shift.
2.2. Data
The study population consists of n = 6 patients, who had undergone iMR-guided DBS electrode implantation through a burr hole targeting the subthalamic nucleus (STN) and experienced detectable shift observed from iMR. Imaging volumes of the patients were acquired with consent and IRB approval. The surgical details can be found in Ivan et al (2014). MR image specifications such as voxel spacing of imaging data (pMR and iMR) are described in Luo et al (2020). Briefly, pMRs and iMRs in this study were acquired using a 1.5 T MR scanner; the voxel spacing for pMR ranges from 1.00 to 2.00 mm, and for iMR ranges from 1.02 to 1.50 mm. An example of the acquired data is shown in figure 2, where brain shift due to burr hole procedure is demonstrated both on the surface as well as subsurface (indicated by corresponding crosshairs at the lateral ventricle). The imaging artifacts due to DBS electrode leads are illustrated by red arrows.
Figure 2.
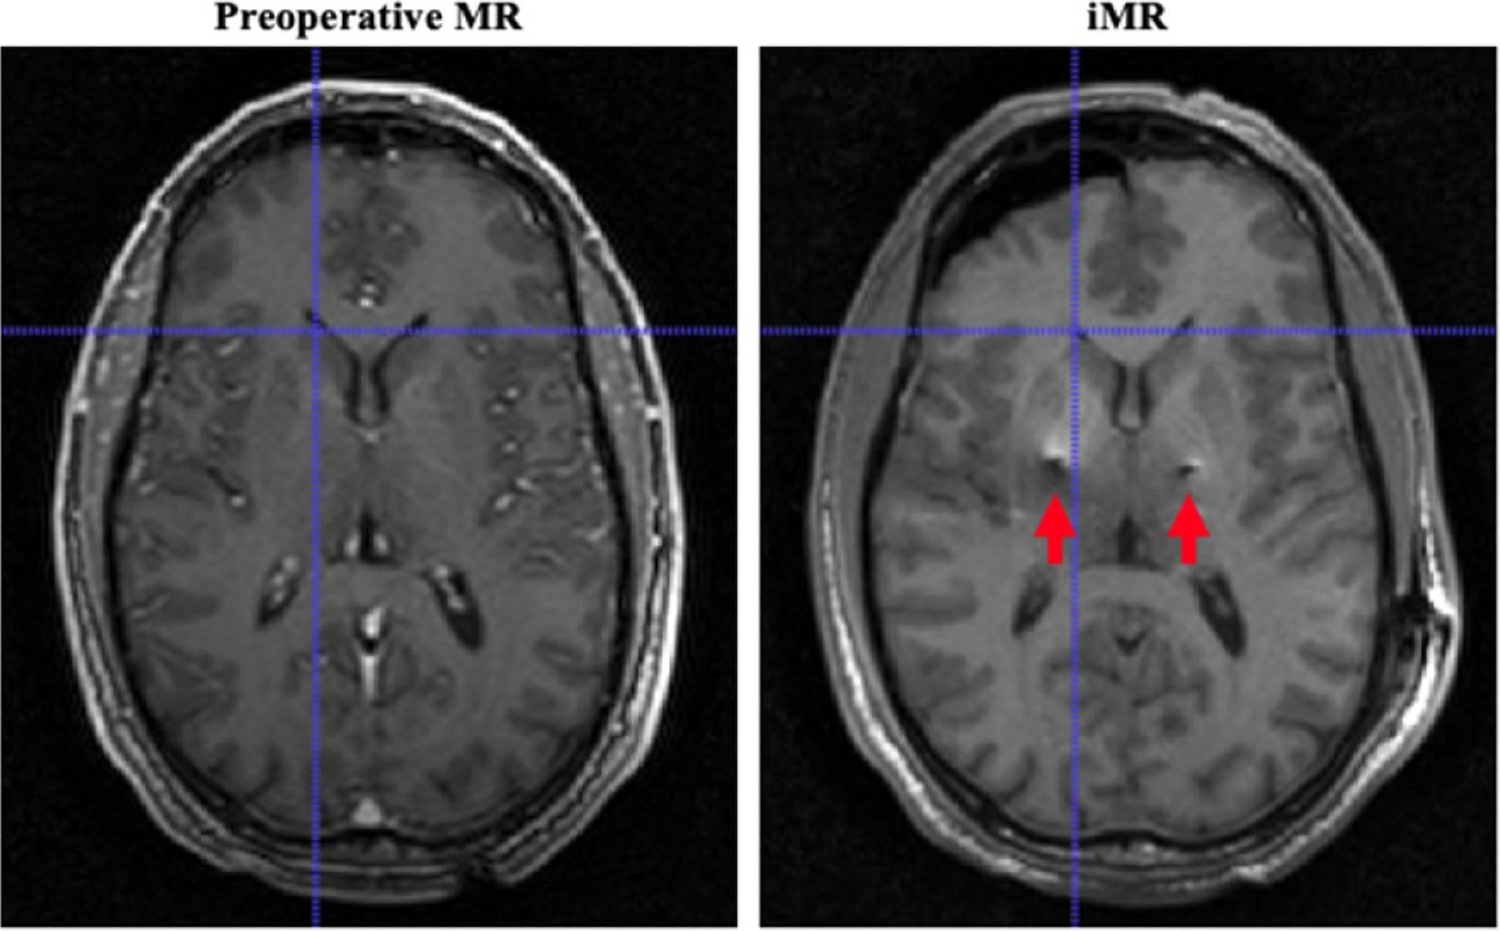
An example of imaging data in this study: demonstration of the impact of brain shift during DBS burr hole surgery on the surface as well as subsurface (corresponding crosshairs at the lateral ventricle). Red arrows indicate the imaging artifacts resulted from implanted electrode leads.
2.3. Brain shift estimation via biomechanical model
To account and estimate for shift during DBS electrode placement through a burr hole (small cranial opening), an inverse problem approach rooted in a biphasic biomechanical model was employed. This modeling approach accounts for biophysical phenomenon such as CSF drainage, gravity, pneumocephalus, and stiffness considerations of different brain components (Luo et al 2020). The complete work regarding the implementation details of the biomechanical modeling method such as boundary condition assignment is described in Luo et al (2020).
Briefly, patient pMR was utilized to construct a volumetric patient-specific FE mesh (Sullivan et al 1997). This mesh was then placed under varying surgical conditions, such as permutations of displacement and pressure conditions. Under each unique surgical condition, a biphasic biomechanical model was employed to compute the volumetric shift profile (Miga 1998). The collection of volumetric deformations from the distribution of boundary and forcing conditions is assembled into a ‘deformation atlas’ (Dumpuri et al 2007, Chen et al 2011, Narasimhan et al 2020). Specifically, the modeling approach leveraged here intends to capture the effect of CSF loss, gravity and pneumocephalus. In particular, the impact of CSF loss and gravity are accounted for as CSF loss reduces buoyancy, therefore introducing tissue sag. Within the aforementioned deformation atlas, different extents of CSF loss were simulated to contribute and ensure the fair distribution required to account for different intraoperative surgical conditions.
To estimate volumetric brain shift during surgery, sparse shift measurements (surface and subsurface) derived from iMR were determined by matching corresponding tissue landmarks (Luo et al 2020). Using these data, an inverse problem approach was employed whereby a linear combination of potential brain shift solutions is determined to best match the aforementioned measurements in a constrained least-squared error manner (Luo et al 2017, 2020). The model-predicted volumetric shift was then used to update pMR to better reflect intraoperative patient anatomy, as well as to estimate shift at target region for DBS therapy.
Finally, as an additional layer of rigor to the analysis, Advanced Normalization Tools (ANTs, employed as a state-of-the-art and robust nonrigid image-to-image registration utility) (Avants et al 2011) were utilized to co-register pMR and iMR to produce a displacement field to independently estimate deep brain target shift for a comparative evaluation to the model-based analysis (Luo et al 2020).
2.4. Potential distribution via bioelectric model
To compute electric potential distribution, a bioelectric FE model based on the Poisson equation using standard conductive biophysics was constructed:
where Ve is the electric potential (Volts), σ is the conductivity tensor (S m−1), and I is the injected current from a source such as an electrode contact. Here the conductivity tensor was incorporated to model tissue heterogeneity and anisotropy. To achieve, the linear relationship described by Tuch et al (2001) was used that relates diffusion tensor to the electrical conductivity tensor:
where σ is the electrical conductivity tensor (S m−1), D is the diffusion tensor (m2 s−1), σe is the effective extracellular electrical conductivity (S m−1), de is the effective extracellular diffusivity (m2 s−1) (Tuch et al 2001, Astrom et al 2012). Here in this experiment, σe/de was set to 0.844 as empirically determined by Tuch et al (2001). Limitations regarding this linear assumption will be further discussed later.
The performance and analysis of tractography were conducted in Montreal Neurological Institute (MNI) space (Fonov et al 2011). The limitation of data availability here, specifically only pMR and iMR, necessitated the need of these evaluations in MNI space, where a number of atlases are available and can be leveraged for this investigation.
To facilitate this process, essential information from previous section (shown in the top panel in figure 3, corresponding to the biomechanical modeling block in black on the left in figure 1) was transformed from patient data to MNI space. Specifically, the displacement 3D fields determined by model- and ANTs- predictions (Dmodel and DANTs in figure 3), as well as positions of DBS leads (end point and trajectory, shown as PANTs and Pmodel in figure 3) were mapped to MNI space. For the latter, briefly, the end point of the electrode path visible on iMR was determined and a second point along the electrode path (such as indicated via red arrows on figure 2) was identified to establish trajectory. The transformation of this information was achieved by registering segmented brains of patient and ICBM 152 (International Consortium for Brain Mapping) T1 weighted images (voxel spacing: 1 × 1 × 1 mm; image dimension: 193 × 229 × 193), the latter is associated with the HCP 1021 template (Human Connectome Project) available in DSI Studio (http://dsi-studio.labsolver.org/) via ANTs, shown in green arrows in figure 3 (Fonov et al 2011, Yeh et al 2013).
Figure 3.
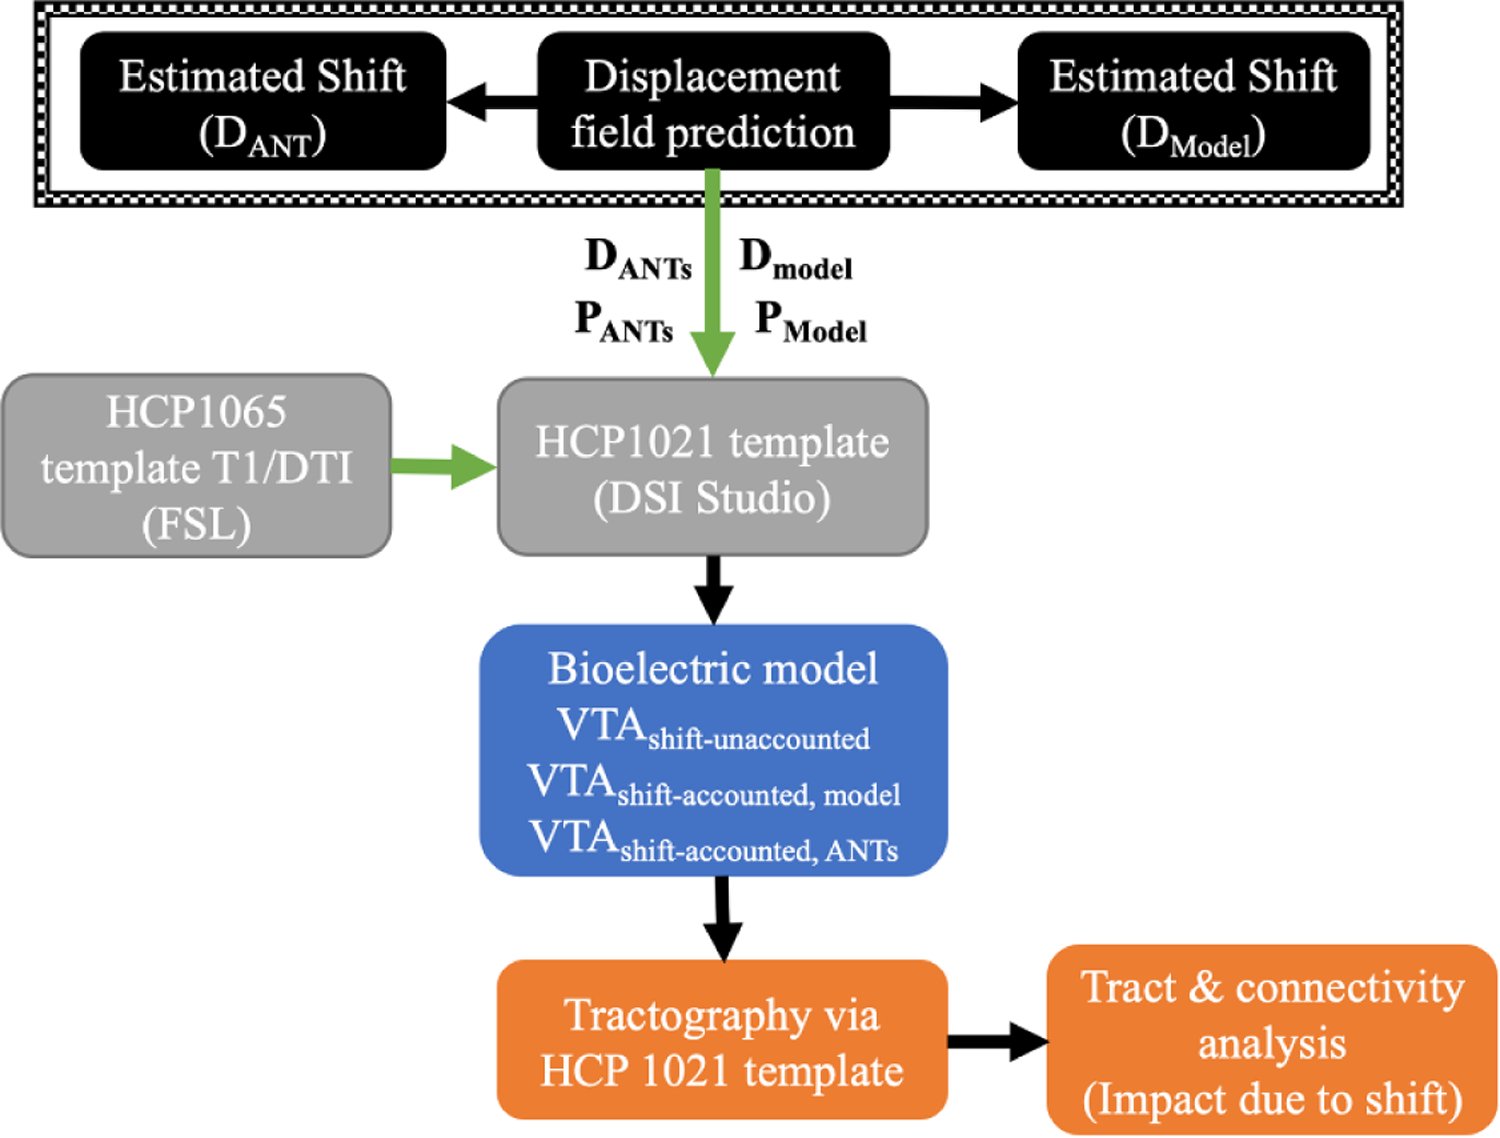
A flowchart of the study: accounting for different shift considerations (model- and ANTs- predictions in black block) within the bioelectric model (blue block) for VTA estimations in HCP 1021 template (grey block), for subsequent examination of tractography (orange block). Overall analysis and modeling are performed in MNI space achieved by co-registration of T1 weighted images via ANTs (represented in green arrows).
Once the displacement profiles were mapped to MNI space, a volumetric brain mesh reflecting the transformed model-predicted displacement profile was constructed and served as the basis of the computational domain of the bioelectric model (blue block in figure 3). In summary, as patient-specific diffusion tensor imaging (DTI) data were not available in this retrospective cohort, the process in figure 3 was specifically designed to estimate that data using an atlas DTI (HCP 1065 template, voxel spacing: 1 × 1 × 1 mm; image dimension: 182 × 218 × 182) available via FSL (Smith et al 2004, Woolrich et al 2009, Jenkinson et al 2012, Glasser et al 2013, Sotiropoulos et al 2013).
Once mapped, the effects of anisotropic and heterogenous conductive modeling environments are incorporated. While a limitation, as utilization of the atlas does not allow for a patient-specific assessment of change, this does allow for a realistic and reasonable approximation of that change.
To complete the computational domain, DBS leads were reconstructed: the transformed end point and trajectory (PANTs and Pmodel) were used in addition to the known manufacturer specifications of Medtronic 3389 (Medtronic Inc., Minneapolis, MN, USA). DBS electrodes were reconstructed and incorporated into the model above. In addition, to account for tissue encapsulation effect, another sub-domain around the electrode contact with the thickness of 0.5 mm was introduced and assigned a conductivity of 0.1 S m−1 (Butson et al 2006, Butson and McIntyre 2008). For mesh generation, a Free Tetrahedral operation was performed using COMSOL Multiphysics (version. 5.4, COMSOL AB, Stockholm, Sweden). Specifically, the element size for the brain domain was calibrated for general physics with predefined size of normal; electrode contacts and the encapsulation layer were given the element size of extra fine. Furthermore, an additional mesh refinement was performed for the domains around electrode contacts where the number of refinements was set to two. The node number for the 18 meshes generated (two deformation possibilities and one undeformed state for six patients) is ~66 654 ± 12 991.
An example of the constructed bioelectric FE mesh model representing deformed patient anatomy (with asymmetric shift in the left frontal lobe) with reconstructed electrode leads (active contact 1 is shown as red and other contacts are shown in black) is demonstrated in figure 4 and is represented in the blue block in figures 1 and 3.
Figure 4.
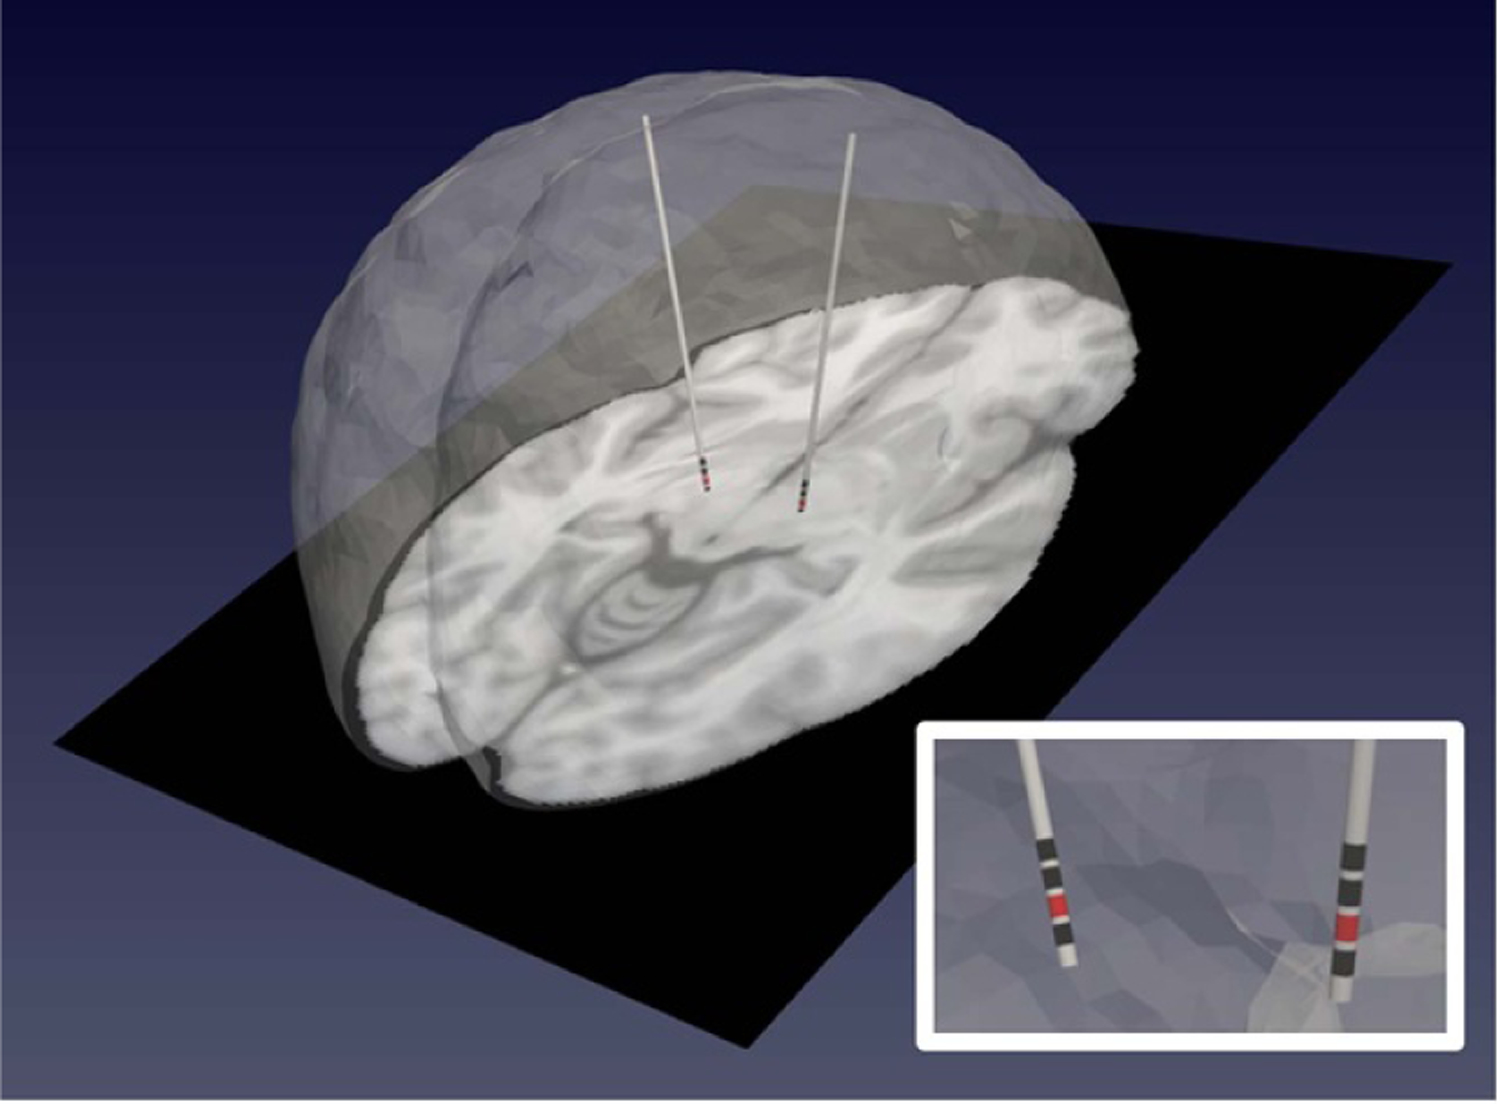
A patient-specific bioelectric model representing deformed patient anatomy (noting asymmetric shift in the left frontal lobe) with reconstructed electrode leads incorporated. Contact 1 is shown as the active contact in red, while other contacts are shown in black.
Lastly, with transformed displacement profiles via model and ANTs, locations of reconstructed electrode leads could be adjusted accordingly within the bioelectric model for simulation.
2.5. VTA and tractography
To better understand the bioelectrical behavior near the electrode contacts, a regular grid of 20 × 20 × 20 mm (Anderson et al 2018, 2019) was defined with the active contact (here contact 1 was active while the brain surface served as the ground) as the centroid. Along each dimension of the grid, 200 evenly distributed grid points were examined for a total of 8 000 000 points. The stimulation configuration in this study was monopolar current stimulation at 3 mA (Butson and McIntyre 2005a). The electric potential profile from the bioelectric model was then used to estimate the VTA, which was based on an isolevel of 0.2 V mm−1 (Astrom et al 2015, Alonso et al 2018). Subsequently deterministic tractography as well as fiber trimming were performed in DSI Studio (Yeh et al 2013) with the estimated VTA as the region of interest (ROI). Here the parameters used were default quantitative anisotropy (qa) threshold, angular threshold of 60°, step size 0.5 mm, smoothing parameter 0.2, length 20.0–200.0 mm, and fiber count of 5000 with an additional termination consideration of seed count of 500 000 (Yeh et al 2013, Luo et al 2019).
The estimation of VTA and tractography were completed in three different configurations of lead reconstructions as noted in the previous section: without shift consideration, with shift consideration via model prediction, and with shift consideration via ANTs prediction.
2.6. Assessing shift impact on neural pathway
Once tractography was estimated in each of the three configurations described in the previous section, tract volume outputted by DSI Studio was directly compared as well as in terms of relative percent change in an effort to assess the differences due to brain shift.
Furthermore, to probe potential impacts on motor functions, volumetric overlap between predicted fiber bundles and regions associated with motor functions (i.e. precentral and postcentral gyri, available through AAL2 (Rolls et al 2015) provided in DSI Studio) was computed. The differences due to brain shift were calculated using the configuration of without shift as the baseline and were related to estimated shift measurements.
Connectivity matrix was obtained using the parcellation atlas of AAL2 (Rolls et al 2015) counting the number of tracts that end in defined regions with the default threshold. Using the connectivity profile without shift consideration as the baseline, comparative changes in each shift-considered connectivity matrix were calculated and further examined.
In order to correlate target region shift or bulk tissue movement at deep brain target reported in Luo et al (2020) with changes in neural pathway prediction, the fiber bundles were converted into a binary mask image and transformed to patient space. To compute the similarity between two fiber bundles, specifically with and without shift consideration (recall for comparison, shift consideration is provided via two configurations: model prediction or ANTs prediction), the Jaccard index (Kosub 2019), or Intersection over Union (IoU), was used as a metric. Jaccard index is defined as follows (Kosub 2019):
where A and B are two finite sets, or here the mask images representing the predicted fiber bundles of interest, and J is the Jaccard index. In this study, the Jaccard index is also referred to as the volumetric overlap as it measures similarity between two sets of fiber bundle of interest: ranging from 0 to 100%, higher percentage presents a greater degree of similarity between two sets. It should be noted that while metrics were examined within the context of each shift prediction method, i.e. model and ANTs, the results were also combined to assess the overall impact of reasonable shift estimations provided by two distinct methods.
3. Results
3.1. Estimated shift at deep brain target
Estimated brain shifts using the biophysics-based model approach and ANTs are reproduced from Luo et al (2020) in table 1. The results in table 1 represent an understanding of bulk tissue movement at deep brain target region and are leveraged later as a variable in the correlation study where the impact of brain shift on recruited pathway is assessed.
Table 1.
Estimated shift at deep brain target region.
| Case # | Right implant (mm) | Left implant (mm) | ||
|---|---|---|---|---|
| Model | ANTs | Model | ANTs | |
| 1 | 3.2 | 2.5 | a | a |
| 2 | 0.4 | 0.5 | 2.0 | 1.2 |
| 3 | 1.1 | 1.1 | 0.3 | 1.4 |
| 4 | 0.2 | 0.6 | 1.6 | 2.7 |
| 5 | 1.8 | 1.3 | 0.5 | 1.0 |
| 6 | 0.5 | 1.2 | 1.8 | 1.6 |
| Average | 1.2 ± 1.1 | 1.2 ± 0.7 | 1.2 ± 0.8 | 1.6 ± 0.7 |
Indicates a unilateral implant.
Overall, the average bulk tissue movement at deep brain target region predicted by the model is 1.2 ± 0.9 mm and ANTs is 1.4 ± 0.7 mm. The findings in Luo et al (2020) stated that with respect to model and ANT prediction comparisons in areas with high feature image contrast, ANTs outperformed the model-based approach at designated tissue feature targets. However, this result was expected given the distinct difference in the density of data driving the two registration methods (i.e. ANTs uses full volumetric intensity data, while the model uses a sparse set of surface and subsurface points). With respect to deep brain targets, the improved performance was not nearly as certain as tissue feature intensity contrast is not as profound (Luo et al 2020). Nevertheless, despite differences, the previous study revealed that each provided a viable shift at the deep brain target region, which provides credence to estimating the impact of these shifts on neural pathway recruitment analyzed herein.
3.2. VTA estimation
VTA estimation (in purple) is illustrated in figure 5, using contact 1 shown in red superimposed with patient MR in the HCP 1021 template space with zoomed perspective.
Figure 5.
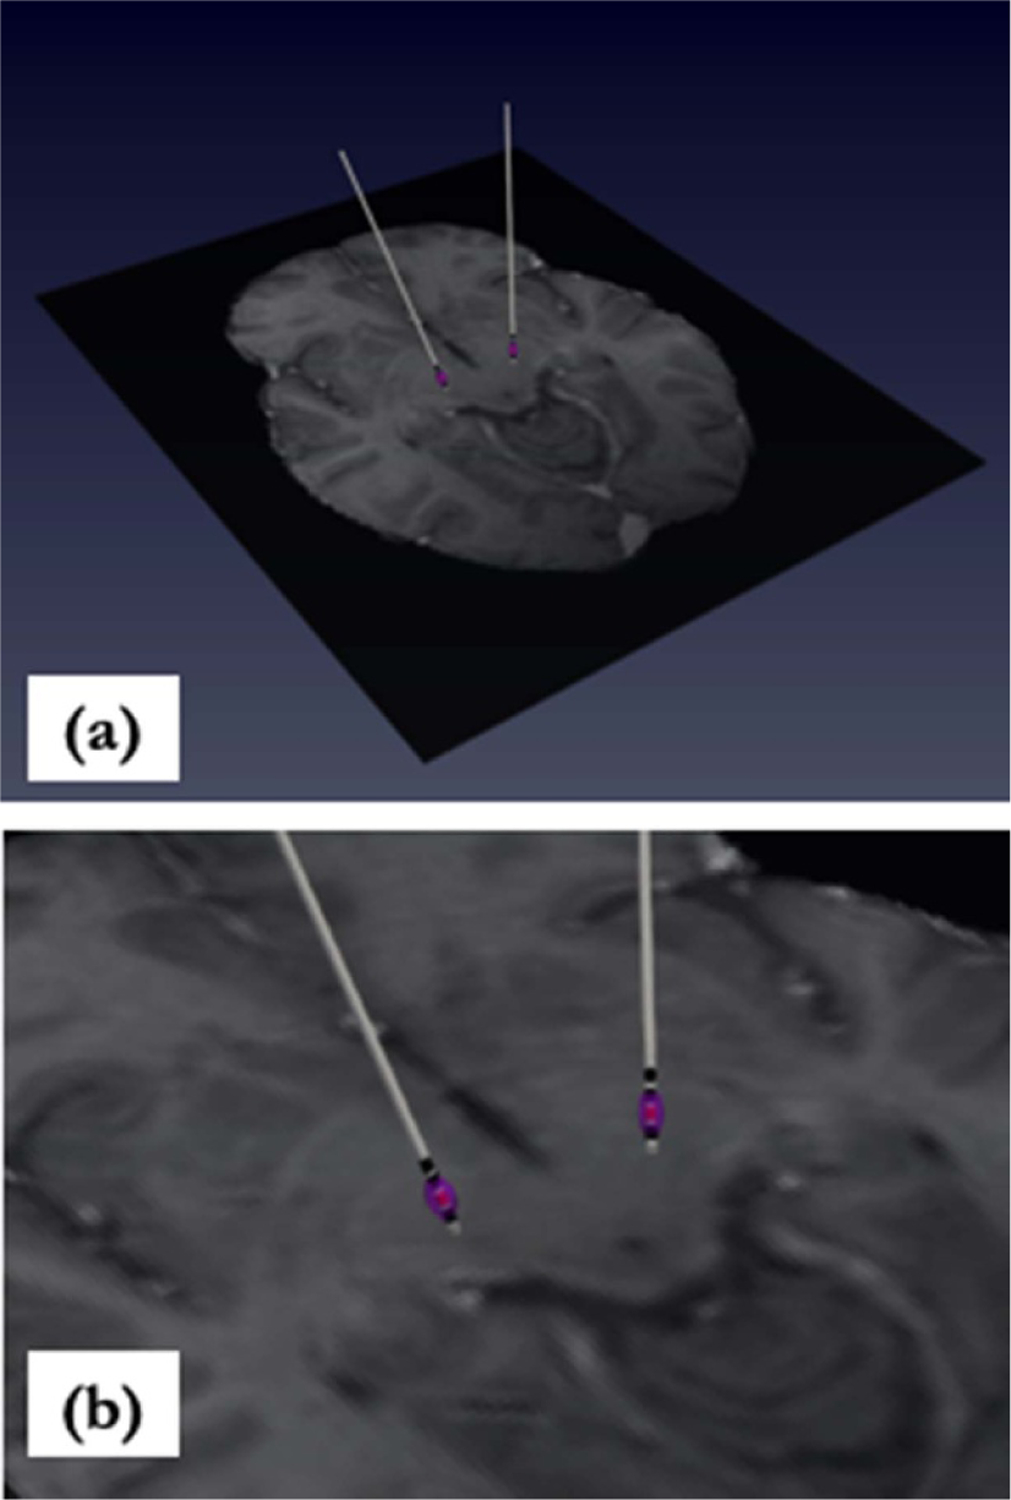
(a) VTA estimation (purple) superimposed with patient MR in HCP 1021 template space. VTA is due to activation of contact 1 (shown in red). (b) Zoomed perspective.
3.3. Tractography prediction
An example of predicted tractography due to estimated VTAs resulted from activation of both implants is shown in figure 6(a). An example of the difference in predicted tractography due to different reconstructed DBS leads as a result of shift consideration is shown in figure 6(b), where blue represents tractography due to reconstructed electrode leads without shift consideration, and red represents leads with model-predicted shift consideration.
Figure 6.
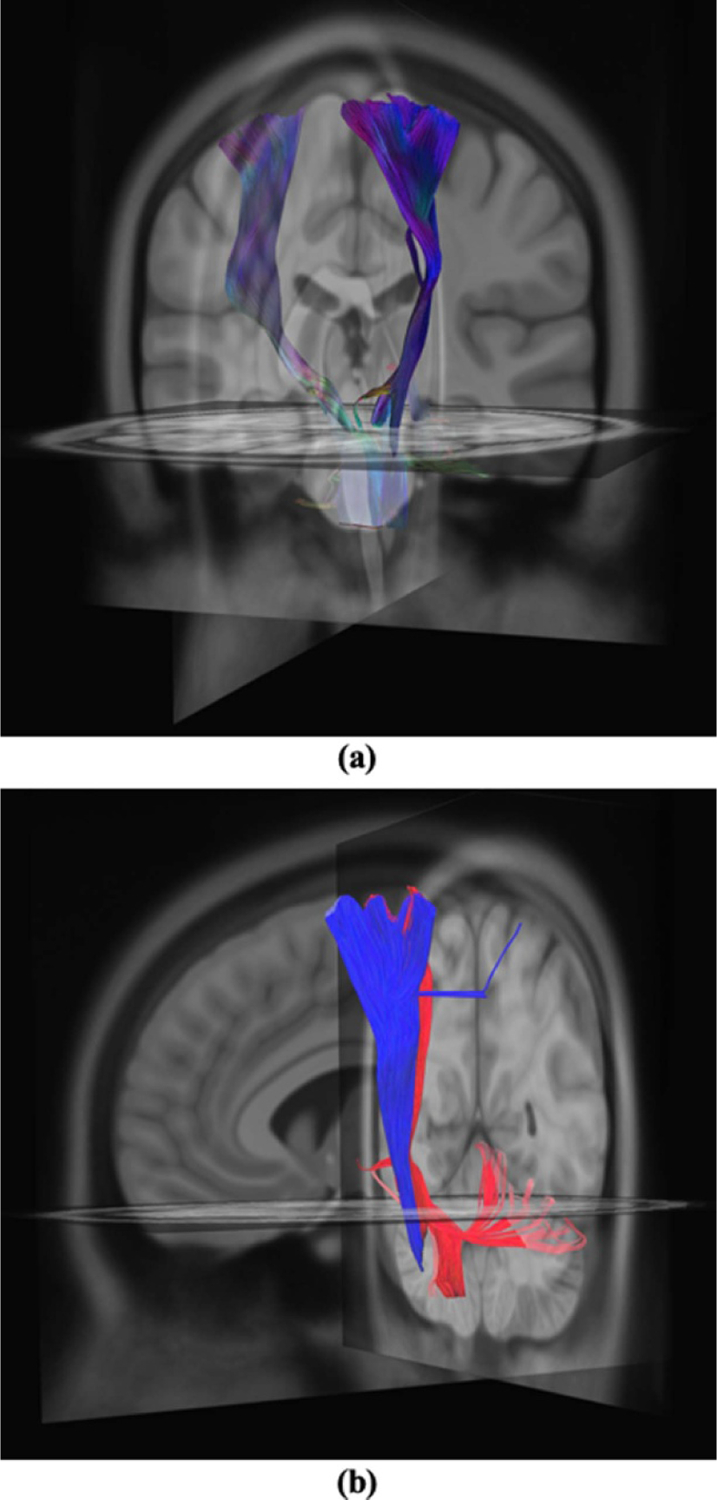
(a) Predicted tractography due to estimated VTAs from neuromodulation of left and right implants. (b) Comparison of tracts without shift consideration (red) and with model-predicted shift consideration (blue).
An examination of tract volume outputted by DSI Studio illustrates the potential impact of shift, which is reported in table 2 (columns 2 and 3). Furthermore, percent change from shift-considered tracts to their counterparts without shift consideration was computed, shown in table 2 (columns 4 and 5).
Table 2.
Tract volume for right and left implants for each case with reconstructed electrode leads under different shift considerations.
| Tract volume (mm3) | Tract volume percent change (%) | |||
|---|---|---|---|---|
| Without shift considered With model shift considered With ANTs shift considered |
Model ANTs | |||
| Case # | Right implant | Left implant | Right implant | Left implant |
| 1 | 10 320 | a | 26.59 | a |
| 14 058 | 22.20 | |||
| 13 265 | ||||
| 2 | 10194 | 616 | 22.42 | 92.85 |
| 8327 | 8611 | 3.83 | 66.79 | |
| 9818 | 1855 | |||
| 3 | 9253 | 10160 | 7.81 | 3.15 |
| 10 037 | 9850 | 9.08 | 1.86 | |
| 10177 | 10 353 | |||
| 4 | 10 624 | 9938 | 1.04 | 25.88 |
| 10515 | 7895 | 1.35 | 51.89 | |
| 10 482 | 6543 | |||
| 5 | 10 963 | 7385 | 49.32 | 3.42 |
| 7342 | 7141 | 21.87 | 10.55 | |
| 8996 | 8256 | |||
| 6 | 10 374 | 9857 | 5.50 | 40.57 |
| 10 978 | 7012 | 22.89 | 6.57 | |
| 8442 | 9249 | |||
| Average | — | — | 18.78 | 33.17 |
| 27.53 | 13.54 | |||
Indicates a unilateral implant.
Analyzing changes in tract volume further, figure 7(a) demonstrates its strong relation with estimated shift: (a) Pearson correlation coefficient (CC) was computed where R = 0.70, 0.83 and 0.67 for absolute difference in tract volume for model prediction, ANTs prediction, and combined data, respectively; (b) for thoroughness, similarly Spearman’s rank CC was also computed where ρ = 0.91, 0.60 and 0.80, respectively for model, ANTs, and combined data, thus both indicating the strong correlative impact of shift.
Figure 7.
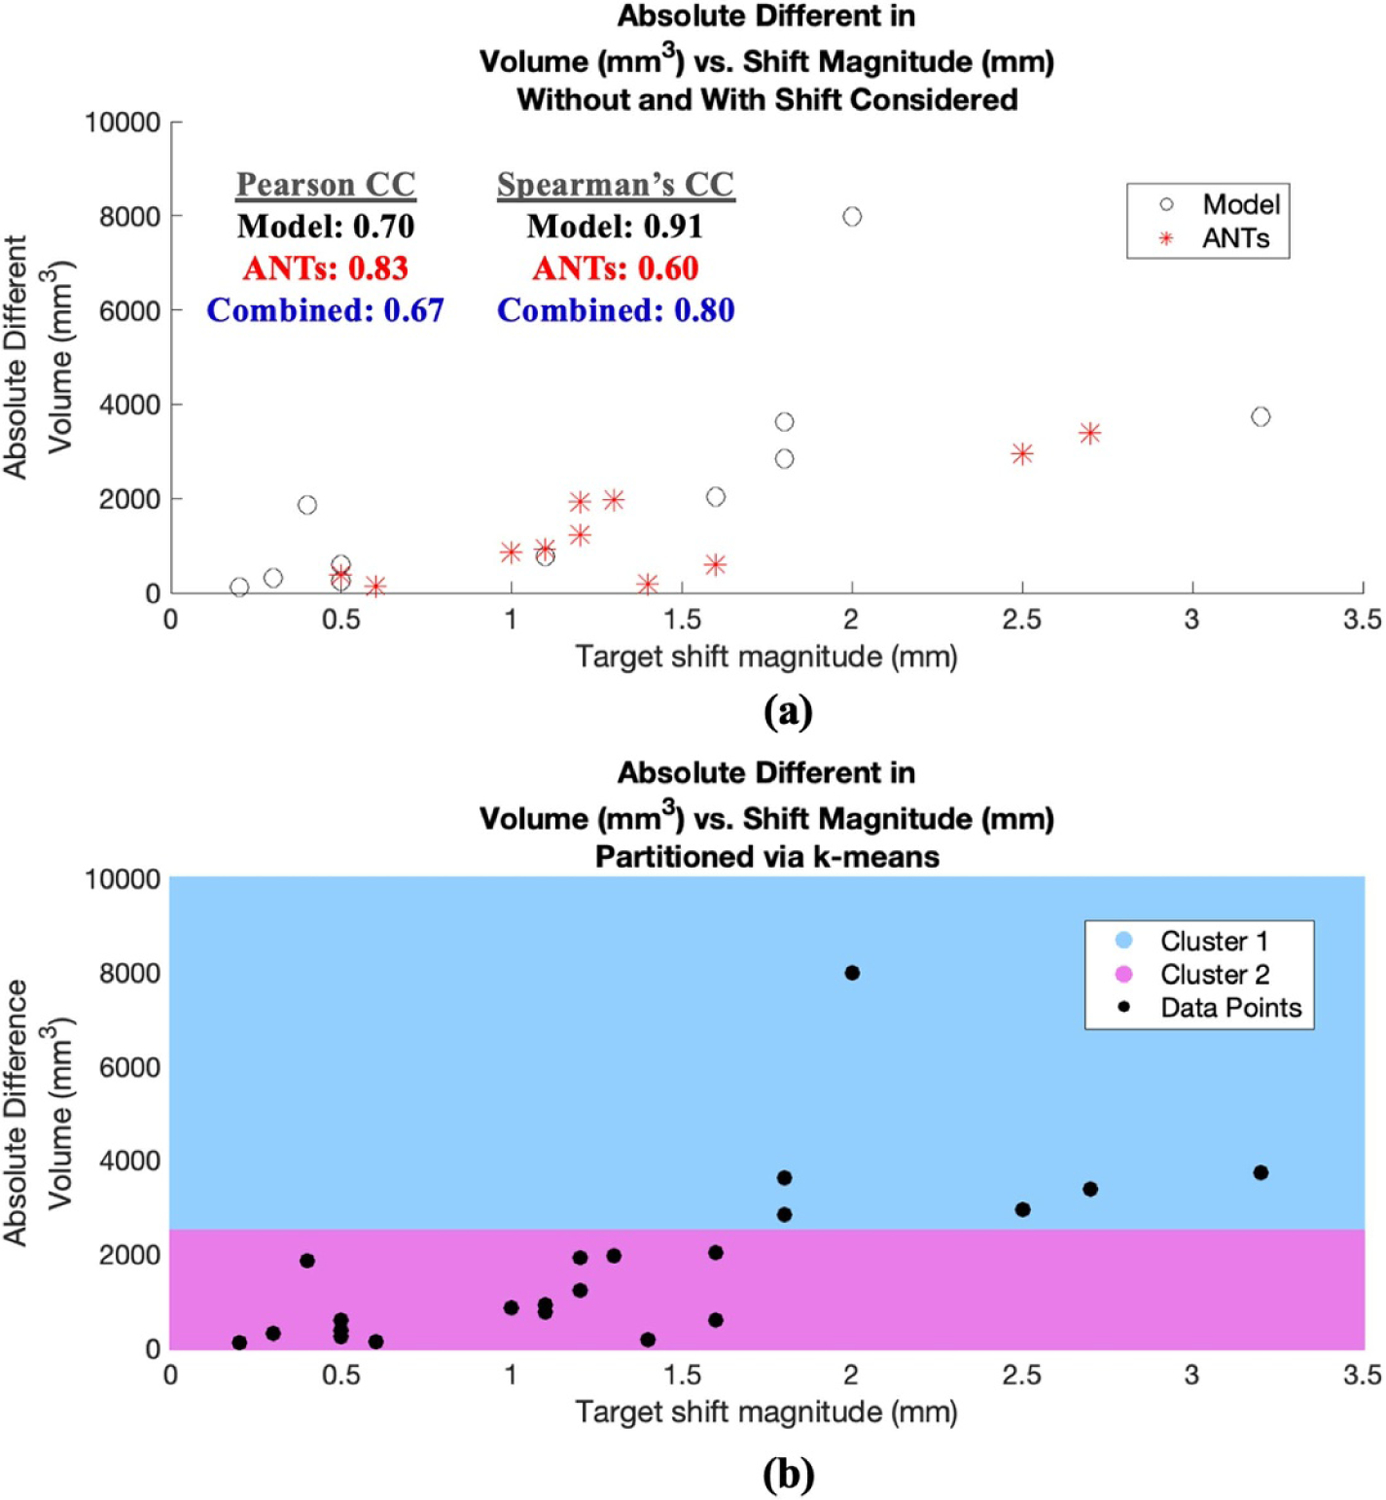
Absolute difference in tract volume vs. estimated shift at deep brain target region. (a) Data points associated with model prediction shown in black and ANTs in red. Pearson and Spearman’s CCs for configurations of model, ANTs, and combined data are also shown, all indicting the impact of shift on tract statistics from baseline without shift consideration. (b) The same data points in (a) are partitioned into two cluster regions via k-means shown in blue and pink, indicating two distinct clusters as shift approaches ~2 mm and change in volume approaches ~2485 mm3.
Since one objective of this study is to assess a possible threshold where tractography output (e.g. tract volume) may be impacted considerably by brain shift, here the combined data points in figure 7(a) were partitioned into two regions to determine such delineation. Specifically, the data points were divided into two cluster regions via k-means, shown in figure 7(b) in pink and blue; interestingly the partition occurred as shift approached ~2 mm and change in volume approached ~2485 mm3.
In addition to tract volume, the volumetric overlap between predicted fiber bundles and regions associated with motor functions, specifically precentral (in orange) and postcentral gyri (in cyan) shown in figure 8(a), was examined. Here the absolute difference in volumetric overlap of two different configurations (no shift vs. model-predicted shift, and no shift vs. ANTs-predicted shift) were computed and summarized in table 3. Figure 8(b) correlates the combined data of the absolute differences in motor ROI volumetric overlap with estimate target shift in table 1. The results suggest the correlative impact of shift on change of fiber bundles’ overlap associated with motor regions (via Pearson CC as R = 0.53).
Figure 8.
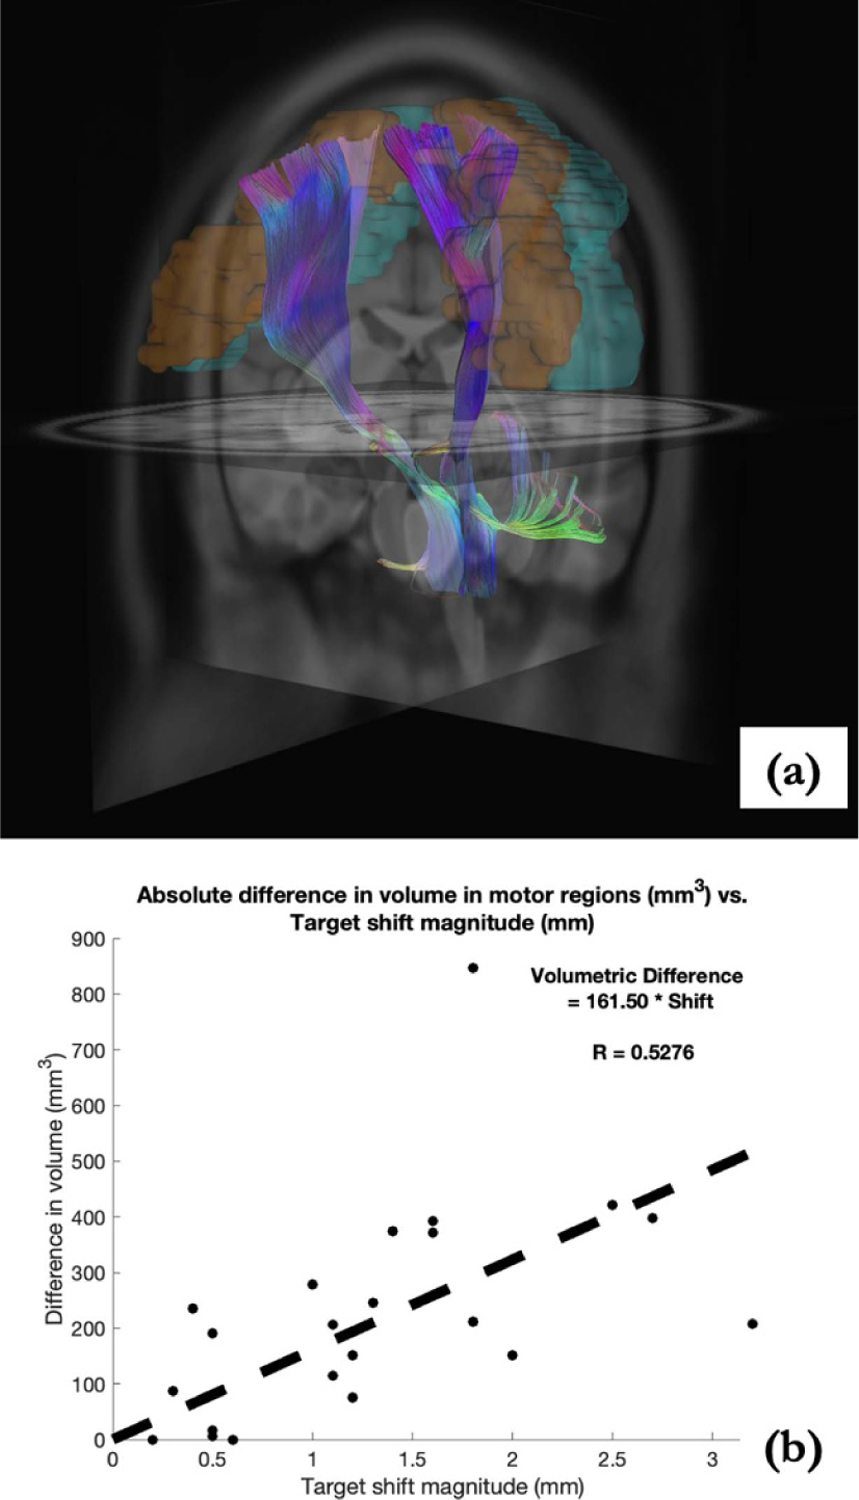
(a) Predicted fiber tracts shown with precentral (orange) and postcentral (cyan) gyri. (b) Absolute change in volumetric overlap with motor regions (no-shift consideration as the baseline) analyzed with estimated shift at target region, suggesting the impact of brain shift, i.e. deviation from surgical plan.
Table 3.
Absolute change in volume overlap between predicted fiber bundles and motor regions of precentral and postcentral gyri.
| Overlapping volume difference (mm3) | ||
|---|---|---|
| No shift vs. model-predicted shift No shift vs. ANTs-predicted shift | ||
| Case # | Right implant | Left implant |
| 1 | 208 | a |
| 421 | ||
| 2 | 235 | 151 |
| 115 | 151 | |
| 3 | 115 | 87 |
| 206 | 374 | |
| 4 | 0 | 372 |
| 0 | 397 | |
| 5 | 847 | 17 |
| 246 | 278 | |
| 6 | 190 | 212 |
| 75 | 392 | |
Indicates a unilateral implant.
3.4. Volumetric overlap (Jaccard index)
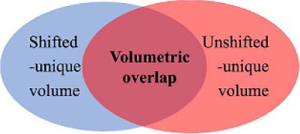
For each patient, the recruited pathway due to implants without shift consideration and its counterpart with shift consideration (model or ANTs) are compared for similarity via the Jaccard index or volumetric overlap. Here, when comparing two fiber bundles/sets in table 4, the combined set of two bundles is considered at 100%, and (a) the subset that is unique to the pathway from without shift consideration is labeled as ‘Unshifted-unique volume fraction’ in table 4. (b) Similarly, the subset that is unique to the pathway with shift consideration is labeled as ‘Shifted-unique volume fraction.’ (c) Lastly, the shared component of the two sets is labeled as ‘Volumetric overlap,’ effectively representing the Jaccard index. This relationship of the three components of interest is further illustrated in the Venn diagram in table 4.
Table 4.
Volumetric distribution of fiber bundles: overlap, and with shift considered (i.e. shifted-unique volume fraction) via model or ANTs and without shift consideration (i.e. unshifted-unique volume fraction). A Venn diagram is provided to further illustrate the three components of interest summarized in table 4 and their relations.
|
With model-predicted shift profile | With ANTs-predicted shift profile | |||||
|---|---|---|---|---|---|---|---|
| Case # | Implant description | Shifted-unique volume fraction (%) | Unshifted-unique volume fraction (%) | Volumetric overlap (%) | Shifted-unique volume fraction (%) | Unshifted-unique volume fraction (%) | Volumetric overlap (%) |
| 1 | Right implant | 33.04 | 50.49 | 16.48 | 38.00 | 52.28 | 9.72 |
| Left implant | a | a | a | a | a | a | |
| 2 | Right implant | 23.80 | 5.56 | 70.64 | 6.86 | 3.59 | 89.55 |
| Left implant | 9.35 | 90.62 | 0.03 | 30.43 | 68.08 | 1.49 | |
| 3 | Right implant | 9.67 | 17.53 | 72.80 | 5.95 | 15.94 | 78.11 |
| Left implant | 13.07 | 8.52 | 78.41 | 26.74 | 26.14 | 47.12 | |
| 4 | Right implant | 0.69 | 0.06 | 99.24 | 1.12 | 0.04 | 98.84 |
| Left implant | 38.98 | 21.30 | 39.72 | 56.58 | 31.77 | 11.65 | |
| 5 | Right implant | 40.92 | 10.63 | 48.45 | 31.66 | 21.53 | 46.81 |
| Left implant | 6.46 | 3.41 | 90.13 | 8.37 | 16.30 | 75.32 | |
| 6 | Right implant | 6.76 | 11.35 | 81.89 | 21.17 | 9.29 | 69.54 |
| Left implant | 45.61 | 20.47 | 33.92 | 25.58 | 18.89 | 55.54 | |
Indicates a unilateral implant.
Results for each patient are summarize in table 4, where volumetric overlap (Jaccard index) is shown in column 5 (model) and column 8 (ANTs), recall differences in displacement profile for model and ANTs predictions. Moreover, the volumetric overlap is plotted with corresponding shift estimation in figure 9. A linear regression was performed with Pearson CC (in figure 9), with model-prediction (red) and ANTs-prediction (blue) separately considered, as well as together.
Figure 9.
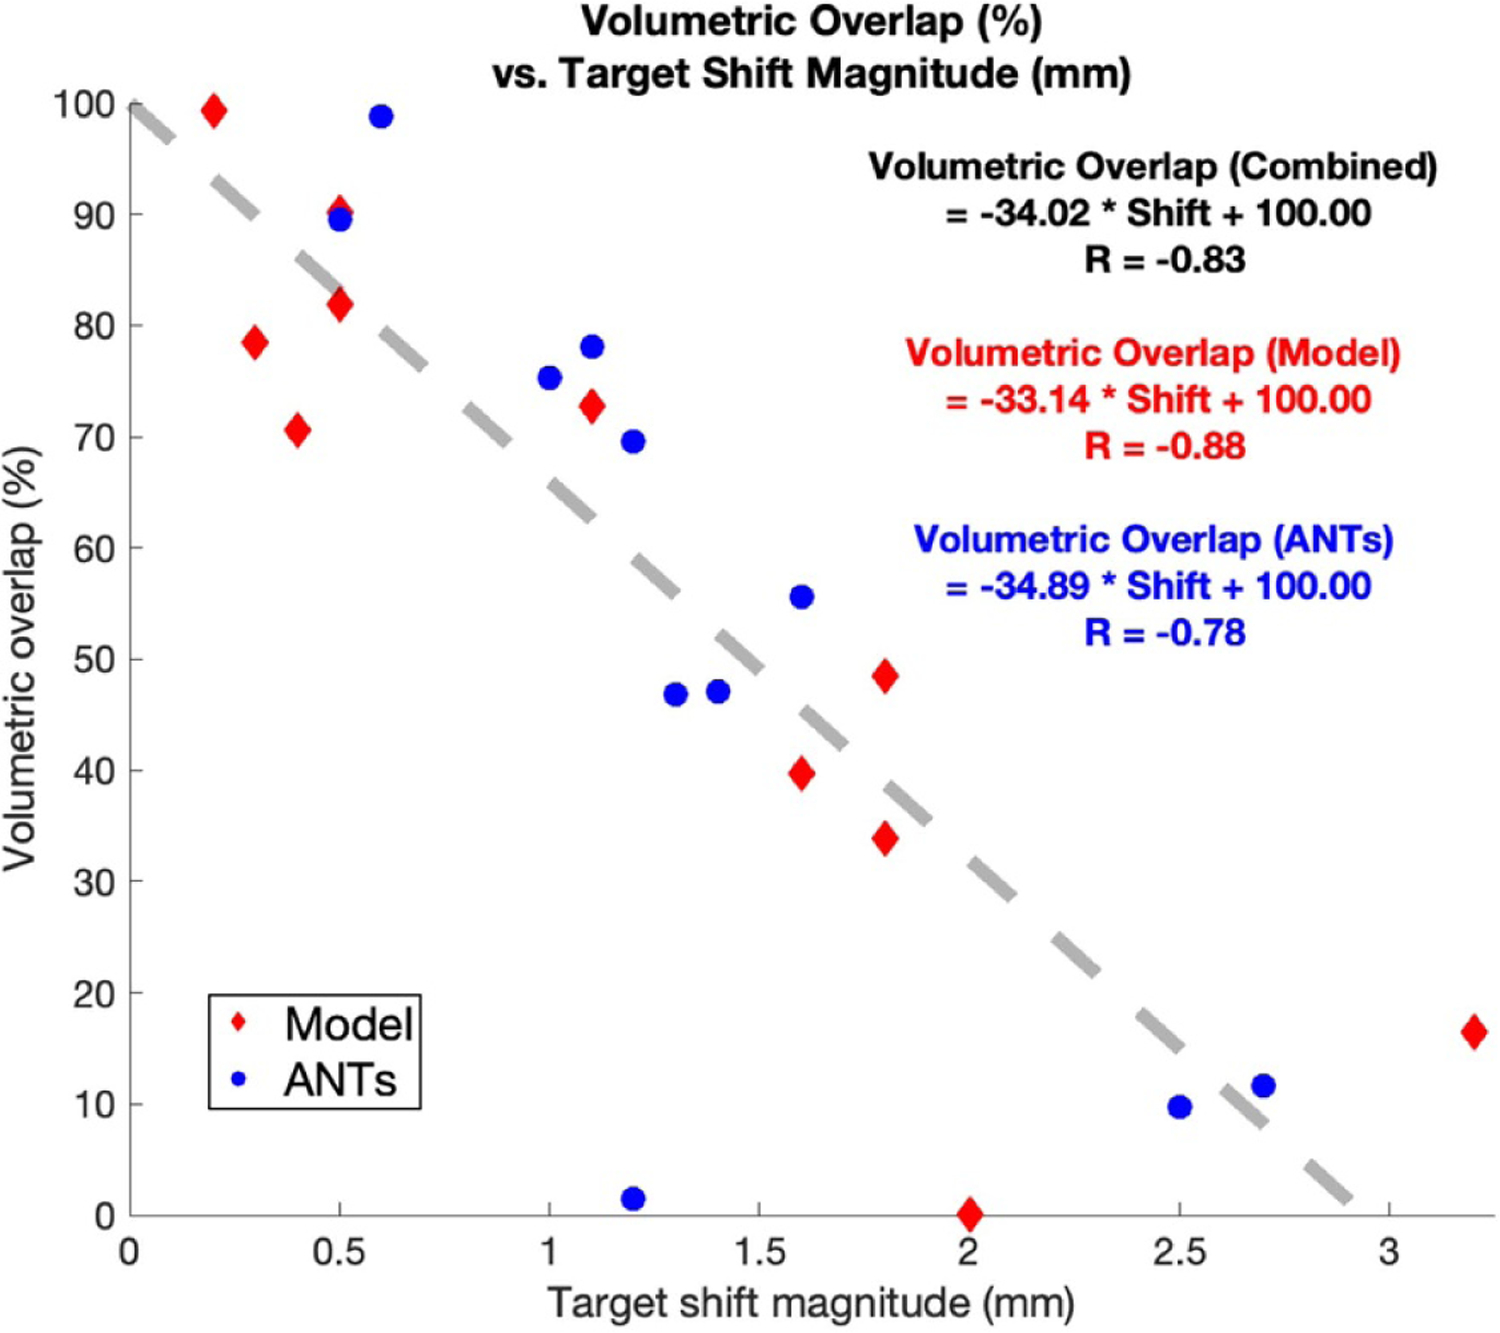
Volumetric overlap vs. estimated shift at deep brain target region. Prediction via model-based approach in red; prediction via ANTs in blue. Linear regression is performed with Pearson CC for model (red), ANTs (blue) and combined data (black).
Here the Pearson CCs were R = −0.88, −0.78 and −0.83 for volumetric overlap resulted from model-prediction, ANTs prediction and combined data, respectively. Moreover, the thresholds at which the estimated volumetric overlap became 0%, i.e. the inverse of the slope in the linear regression shown in figure 9 are 3.02, 2.87, and 2.94 mm, respectively for model-prediction, ANTs prediction and combined data.
3.5. Connectivity profile
Using the multi-physics models and fiber tract recruitment strategies in the previous sections, a connectivity matrix can be determined via DSI Studio with respect to precentral and postcentral gyri, considered to contribute to motor response in DBS (Accolla et al 2016, Younce et al 2019). Structural connectivity change within the context of model- and ANTs-based predictions was computed. This connectivity profile that represents changes from baseline to its shifted counterpart normalized in a connecto-gram (Kassebaum 2020) is illustrated in figure 10. The width of the line represents the strength of change. The details describing regions in the parcellation atlas of AAL2 in figure 10 can be found in Rolls et al (2015).
Figure 10.
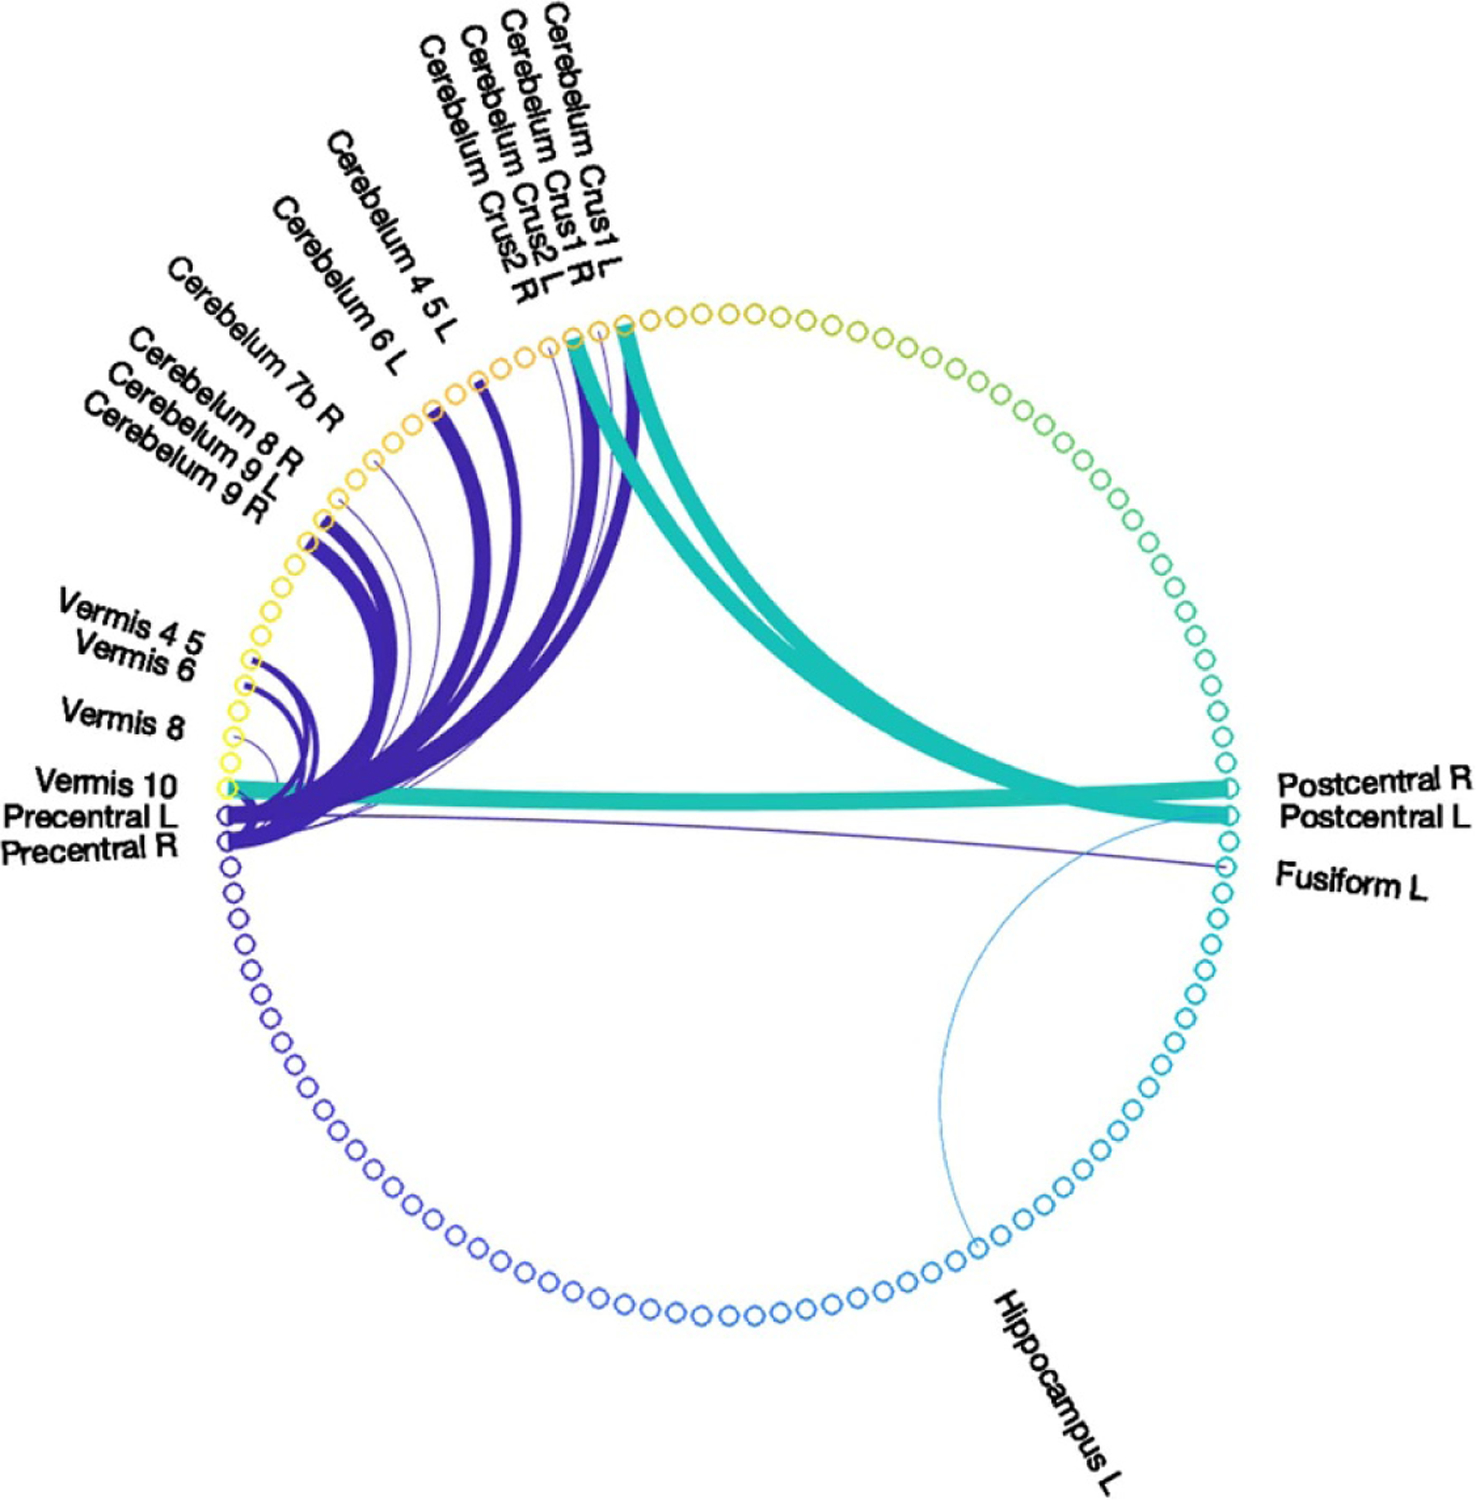
Connectivity change of shift-considered connectivity matrices from without shift consideration with respect to precentral and postcentral gyri, where line width represents the extent of change.
4. Discussion
An analysis on the impact of intraoperative brain shift, derived from pMR and iMR imaging data, on fiber tract recruitment was conducted using a multi-physics FE modeling approach. When this framework was applied to six patients with pMR and iMR data, a critical threshold was characterized where deviation from the intended target could potentially result in sharp decreases in efficacy. It was determined that a strong linear relation exists between the deviation from intended target and changes in intended neural pathway activation with Pearson CC of −0.83. With respect to the degradation of activation, figure 9 predicts that at a target error of ~2.94 mm, all intended activation would be affected. This threshold, determined via realistic shift estimated from two different shift prediction methods (biophysics-modeling and ANTs), provides quantitative evidence supporting previous observations that deviation/misplacement of ~2–3 mm may introduce inadequate treatment or poor outcome. While these conventional thresholds have been noted, to our knowledge the linear relationship found in figure 9 is quite profound in that it estimates an approximate 34% degradation in intended intentional functional activation per 1 mm of targeting error in electrode positioning. It should also be noted that in data not reported here, activation of remaining contacts (i.e. contacts 0, 2 and 3) were also examined and yielded similar trends to that of contact 1. As a comparator, equivalent Pearson CCs of active −0.82, −0.92 and −0.94 were calculated for active contacts 0, 2 and 3, respectively. In addition, the estimated threshold at which intended activation degrades to 0%, was 3.10, 2.75 and 2.61 mm for active contacts 0, 2 and 3, respectively. Given limitations and errors associated with data processing and modeling that will be discussed later, this estimation ranging from 2.61 to 3.10 mm at which intended neural pathway recruitment is lost is remarkably consistent with experiences in the literature. For example, in Kremer et al, an intraoperative CT (iCT) system was employed to verify lead placement, lead repositioning was deemed necessary if misplacement error of greater than 2 mm from intended target was detected (Kremer et al 2019).
In addition to the volumetric overlap metric, it is important to note the changes induced by brain shift on other metrics: (a) for tract volume in table 2, the average relative change of tract volume can be up to 33.2%. Furthermore, when correlation between absolute difference in volume and estimated deep brain target region shift was examined among conditions without and with shift considerations, correlative impact of shift on tract volume was observed and is shown in figure 7. For tract volume, specifically for Pearson CC, R = 0.67 for the combined data points and for Spearman’s rank CC, ρ = 0.80. (b) For overlapping volume with motor regions in table 3, correlative impact of shift on changes of the overlapping volume was examined and a moderate Pearson CC of R = 0.53 was determined in figure 8. (c) Moreover, figure 10 illustrates the changes in connectivity profile due to shift (model and ANTs) with respect to precentral and postcentral gyri. A notable connection alteration between configurations with and without shift consideration is the cerebellum. Recent studies have shown that in addition to basal ganglia (including STN), cerebellum may have functional implications on pathophysiology of PD such as motor learning (Wu and Hallett 2013, Sweet et al 2014, Marcelino et al 2019). Such connectivity alteration to cerebellum with its potential therapeutic implications further illustrate the need to account for brain shift in electrode placement and stimulation.
However, it is important to note several limitations of the study. First, additional considerations for stimulation modeling are desired. While considering nature of the medium with current or voltage input, the model here only evaluates purely conductive medium without considering frequency-dependency of both the capacitive effects in the medium and stimulus waveform utilized clinically. As noted by Butson et al, the approach taken here may overestimate VTA where error may be attributed to stimulation pulse width and electrode capacitance (Butson and McIntyre 2005b). Fourier FEM (finite element modeling) should be considered in the future to account for frequency-dependence of stimulus waveform as well as capacitive effects of the computational medium (Butson and McIntyre 2005b, Howell and McIntyre 2016). Lastly, we would like to acknowledge that the simple linear relation used for obtaining conductivity properties from diffusion tensor can be improved. Studies (Wu et al 2018, Nordin et al 2021) have observed some impacts/deficiencies in the relation derived by Tuch et al (2001): e.g. Wu et al (2018) noted that it is based on effective medium theory and does not directly and adequately account for the impact of the structures and natures of the brain tissues. Therefore, more sophisticated methods such as in Schmidt and Rienen (2012) and Howell and McIntyre (2016) relating diffusion tensor to the conductivity tensor can further improve and refine the establishment of the anisotropic and heterogenous medium. Nevertheless, while important, as the purpose of this study was to demonstrate relative changes, the work reported has considerable independent value.
A second limitation is with respect to the estimation of VTA. A number of methods reviewed in Gunalan et al have been proposed to obtain VTA or to estimate neural responses due to stimulation (Gunalan et al 2018). The VTA estimation similar to Astrom et al (2015) and (2018) was selected here for its computational efficiency in this initial analysis. However, it is recognized that VTA-based method has limitations noted by Gunalan et al (2018), particularly with bipolar and multipolar stimulation conditions (Duffley et al 2019). Field-cable (FC) model, i.e. multi-compartment cable models of axons in the NEURON modeling environment, considered the gold standard, would provide better estimation of neural activation (McNeal 1976, McIntyre and Foutz 2013, Sweet et al 2016, Howell and McIntyre 2016, Gunalan et al 2018, McIntyre 2018). In particular, impact and sensitivity of fiber orientation on functional outcome of DBS therapy could be further considered, similar to in Lehto et al (2017) and Slopsema et al (2021) where functional MRI (fMRI) was leveraged. The approach of leveraging NEURON modeling environment as well as accounting for fiber orientation where pathway activation percentage can be assessed should be a part of further retrospective analysis on the impact of shift on neural pathway recruitment (Lehto et al 2017, Gunalan et al 2018, Anderson et al 2019, Duffley et al 2019, Slopsema et al 2021).
Another limitation of the study is the lack of patient-specific diffusion weighted imaging (DWI) data, which necessitated a number of registrations performed here to the population-averaged template space (indicated by the green arrows in figure 3), which could contribute to potential registration bias. Specifically, given the pathology of the patients in this study, they may deviate from healthy DWI on a patient level due to possible atrophy from disease duration. However, a recent report examined the connectivity analysis via patient specific information vs. normative atlases, the latter being the approach taken in this work, and found that while not interchangeable, the connectivity profiles produced by each method can yield similar conclusions with respect to clinical outcome (Wang et al 2020). This does provide some credence to the overall conclusions drawn in this study with the use of the population-averaged template. Nevertheless, this comparison report described above (Wang et al 2020) does note that, while results are not statistically significant, patient-specific information may lead to slightly better prediction of clinical outcomes. Therefore, future work will involve the acquisition of patient-specific DWI and conduct a similar comparison study to extend the findings of this study.
Moreover, for future directions, there are two possibilities to consider: (a) for shift assessment, a better understanding with final lead position via postop imaging data could provide further data points, in addition to intraoperative brain shift, of the impact of shift on clinical outcome in a longitudinal manner, similar to a promising study recently conducted by (Goransson et al 2020); (b) clinical effects, instead of simulated tractography, would be preferred and desired.
Despite the limitations outlined above, the experimental design reported provides a consistent and identical modeling environment for all simulations within this comparison study. In this context, similar estimation errors and limitations (i.e. registration, localization, shift measurements, etc) are present and expected among all groups; thus, the overall conclusions regarding the impact of brain shift on neural pathway recruitment, while not absolute, do become informative rather than definitive.
5. Conclusion
A retrospective analysis was performed to assess the impact of brain shift on DBS functional outcome as evaluated by tractography. The analysis leverages a multi-physics biomechanical and bioelectric modeling framework. The former provides realistic intraoperative brain shift estimation, and the latter is used to predict electric potential. The potential solution profile is subsequently used to estimate VTA and predict the recruitment of neural pathways. With the application of this analysis framework to the preop- and intraop-imaging data of six patients, shift consideration at deep brain target region is demonstrated to introduce differences in tract volume, motor ROI volumetric overlap, as well as connectivity profile. A strongly negative correlation is found between deviation from intended target and recruitment of neural pathways, where a threshold average of ~2.85 mm across all lead electrodes is determined to critically degrade intended neural pathway recruitment. In addition, an estimate of the rate of intended neural pathway recruitment degradation as a function of target error was determined, i.e. an approximate 34% degradation in neural recruitment for every 1 mm in electrode positioning error. This finding provides quantitative evidence to support literature reports that deviations of 2–3 mm from intended target produces poor or inadequate clinical outcomes. This is important as such deviations can result in lead position revision or removal altogether. Finally, while the framework provided has served as an analysis tool for data taken intraoperatively, the fidelity of the results does provide an exciting prospect for the use of multi-physics models as an inexpensive planning, guidance, and delivery platform for DBS therapy.
Acknowledgments
This work is supported by the National Institute for Neurological Disorders and Stroke, of the National Institutes of Health, R01NS049251.
Data availability statement
The data generated and/or analysed during the current study are not publicly available for legal/ethical reasons but are available from the corresponding author on reasonable request.
References
- Accolla EA, Ruiz MH, Horn A, Schneider GH, Schmitz-Hubsch T, Draganski B and Kuhn AA 2016. Brain networks modulated by subthalamic nucleus deep brain stimulation Brain 139 2503–15 [DOI] [PubMed] [Google Scholar]
- Alonso F, Vogel D, Johansson J, Wardell K and Hemm S 2018. Electric field comparison between microelectrode recording and deep brain stimulation systemsa simulation study Brain Sci. 8 15. [DOI] [PMC free article] [PubMed] [Google Scholar]
- Anderson DN, Duffley G, Vorwerk J, Dorval AD and Butson CR 2019. Anodic stimulation misunderstood: preferential activation of fiber orientations with anodic waveforms in deep brain stimulation J. Neural Eng 16 11. [DOI] [PMC free article] [PubMed] [Google Scholar]
- Anderson DN, Osting B, Vorwerk J, Dorval AD and Butson CR 2018. Optimized programming algorithm for cylindrical and directional deep brain stimulation electrodes J. Neural Eng 15 18. [DOI] [PubMed] [Google Scholar]
- Astrom M, Diczfalusy E, Martens H and Wardell K 2015. Relationship between neural activation and electric field distribution during deep brain stimulation IEEE Trans. Biomed. Eng 62 664–72 [DOI] [PubMed] [Google Scholar]
- Astrom M, Lemaire JJ and Wardell K 2012. Influence of heterogeneous and anisotropic tissue conductivity on electric field distribution in deep brain stimulation Med. Biol. Eng. Comput 50 23–32 [DOI] [PubMed] [Google Scholar]
- Avants BB, Tustison NJ, Song G, Cook PA, Klein A and Gee JC 2011. A reproducible evaluation of ANTs similarity metric performance in brain image registration Neuroimage 54 2033–44 [DOI] [PMC free article] [PubMed] [Google Scholar]
- Balachandran R, Mitchell JE, Dawant BM and Fitzpatrick JM 2009. Accuracy evaluation of microtargeting platforms for deep-brain stimulation using virtual targets IEEE Trans. Biomed. Eng 56 37–44 [DOI] [PMC free article] [PubMed] [Google Scholar]
- Bratsos SP, Karponis D and Saleh SN 2018. Efficacy and safety of deep brain stimulation in the treatment of parkinson’s disease: a systematic review and meta-analysis of randomized controlled trials Cureus 10 20. [DOI] [PMC free article] [PubMed] [Google Scholar]
- Butson CR, Cooper SE, Henderson JM and McIntyre CC 2007. Patient-speciftic analysis of the volume of tissue activated during deep brain stimulation Neuroimage 34 661–70 [DOI] [PMC free article] [PubMed] [Google Scholar]
- Butson CR, Maks CB and McIntyre CC 2006. Sources and effects of electrode impedance during deep brain stimulation Clin. Neurophysiol 117 447–54 [DOI] [PMC free article] [PubMed] [Google Scholar]
- Butson CR and McIntyre CC 2005a. Tissue and electrode capacitance reduce neural activation volumes during deep brain stimulation Clin. Neurophysiol 116 2490–500 [DOI] [PMC free article] [PubMed] [Google Scholar]
- Butson CR and McIntyre CC 2008. Current steering to control the volume of tissue activated during deep brain stimulation Brain Stimul. 1 7–15 [DOI] [PMC free article] [PubMed] [Google Scholar]
- Butson CR and McIntyre CC and IEEE 2005b. 2nd Int. IEEE/EMBS Conf. on Neural Engineering (Arlington, VA, 16–20 March 2005) vol Series (New York: IEEE; ) pp 196–7 [Google Scholar]
- Chaturvedi A, Butson CR, Lempka SF, Cooper SE and McIntyre CC 2010. Patient-specific models of deep brain stimulation: influence of field model complexity on neural activation predictions Brain Stimul. 3 65–77 [DOI] [PMC free article] [PubMed] [Google Scholar]
- Chen I, Coffey AM, Ding S, Dumpuri P, Dawant BM, Thompson RC and Miga MI 2011. Intraoperative brain shift compensation: accounting for dural septa IEEE Trans. Biomed. Eng 58 499–508 [DOI] [PMC free article] [PubMed] [Google Scholar]
- Choi KS, Noecker AM, Riva-Posse P, Rajendra JK, Gross RE, Mayberg HS and McIntyre CC 2018. Impact of brain shift on subcallosal cingulate deep brain stimulation Brain Stimul. 11 445–53 [DOI] [PMC free article] [PubMed] [Google Scholar]
- Collins KL, Lehmann EM and Patil PG 2010. Deep brain stimulation for movement disorders Neurobiol. Dis 38 338–45 [DOI] [PubMed] [Google Scholar]
- Duffley G, Anderson DN, Vorwerk J, Dorval AD and Butson CR 2019. Evaluation of methodologies for computing the deep brain stimulation volume of tissue activated J. Neural Eng 16 15. [DOI] [PMC free article] [PubMed] [Google Scholar]
- Dumpuri P, Thompson RC, Dawant BM, Cao A and Miga MI 2007. An atlas-based method to compensate for brain shift: preliminary results Med. Image Anal 11 128–45 [DOI] [PMC free article] [PubMed] [Google Scholar]
- Elias WJ, Fu KM and Frysinger RC 2007. Cortical and subcortical brain shift during stereotactic procedures J. Neurosurg 107 983–8 [DOI] [PubMed] [Google Scholar]
- Fonov V, Evans AC, Botteron K, Almli CR, McKinstry RC, Collins DL and Brain Dev Cooperative G 2011. Unbiased average age-appropriate atlases for pediatric studies Neuroimage 54 313–27 [DOI] [PMC free article] [PubMed] [Google Scholar]
- Glasser MF et al. 2013. The minimal preprocessing pipelines for the human connectome project Neuroimage 80 105–24 [DOI] [PMC free article] [PubMed] [Google Scholar]
- Goransson N, Johansson JD, Wardell K and Zsigmond P 2020. Postoperative lead movement after deep brain stimulation surgery and the change of stimulation volume Stereotact. Funct. Neurosurg 9 [DOI] [PubMed] [Google Scholar]
- Gunalan K, Howell B and McIntyre CC 2018. Quantifying axonal responses in patient-specific models of subthalamic deep brain stimulation Neuroimage 172 263–77 [DOI] [PMC free article] [PubMed] [Google Scholar]
- Horn A et al. 2019. Lead-DBS v2: towards a comprehensive pipeline for deep brain stimulation imaging Neuroimage 184 293–316 [DOI] [PMC free article] [PubMed] [Google Scholar]
- Howell B and McIntyre CC 2016. Analyzing the tradeoff between electrical complexity and accuracy in patient-specific computational models of deep brain stimulation J. Neural Eng 13 036023. [DOI] [PMC free article] [PubMed] [Google Scholar]
- Ivan ME, Yarlagadda J, Saxena AP, Martin AJ, Starr PA, Sootsman WK and Larson PS 2014. Brain shift during bur hole-based procedures using interventional MRI J. Neurosurg 121 149–60 [DOI] [PubMed] [Google Scholar]
- Jenkinson M, Beckmann CF, Behrens TE, Woolrich MW and Smith SM 2012. FSL Neuroimage 62 782–90 [DOI] [PubMed] [Google Scholar]
- Kassebaum P circularGraph GitHub (available at: www.github.com/paul-kassebaum-mathworks/circularGraph) (Accessed 22 March 2020)
- Kosub S 2019. A note on the triangle inequality for the Jaccard distance Pattern Recognit. Lett 120 36–38 [Google Scholar]
- Kremer NI, Oterdoom DLM, Van Laar PJ, Pina-Fuentes D, Van Laar T, Drost G, Van Hulzen ALJ and Van Dijk JMC 2019. Accuracy of intraoperative computed tomography in deep brain stimulation—a prospective noninferiority study Neuromodulation 22 472–7 [DOI] [PMC free article] [PubMed] [Google Scholar]
- Lehto LJ. et al. Orientation selective deep brain stimulation. J. Neural Eng. 2017;14:9. doi: 10.1088/1741-2552/aa5238. [DOI] [PMC free article] [PubMed] [Google Scholar]
- Luo M, Frisken SF, Weis JA, Clements LW, Unadkat P, Thompson RC, Golby AJ and Miga MI 2017. Retrospective study comparing model-based deformation correction to intraoperative magnetic resonance imaging for image-guided neurosurgery J. Med. Imaging 4 16. [DOI] [PMC free article] [PubMed] [Google Scholar]
- Luo M, Larson PS, Martin AJ, Konrad PE and Miga MI 2019. Medical Image Computing and Computer Assisted Intervention—MICCAI 2019 vol Series (Cham: Springer International Publishing; ) pp 682–90 [Google Scholar]
- Luo M, Larson PS, Martin A and Miga MI 2020. Accounting for deformation in deep brain stimulation surgery with models: comparison to interventional magnetic resonance imaging IEEE Trans. Biomed. Eng 67 2934–44 [DOI] [PMC free article] [PubMed] [Google Scholar]
- Marcelino ALD, Horn A, Krause P, Kuhn AA and Neumann WJ 2019. Subthalamic neuromodulation improves short-term motor learning in Parkinson’s disease Brain 142 2198–206 [DOI] [PubMed] [Google Scholar]
- McClelland S, Ford B, Senatus PB, Winfield LM, Du YE, Pullman SL, Yu Q, Frucht SJ, McKhann GM and Goodman RR 2005. Subthalamic stimulation for Parkinson disease: determination of electrode location necessary for clinical efficacy Neurosurg. Focus 19 E12. [PubMed] [Google Scholar]
- McIntyre CC 2018. Neuromodulation Second ed Krames ES et al. (New York: Academic; ) pp 129–35 [Google Scholar]
- McIntyre CC and Foutz TJ 2013. Computational modeling of deep brain stimulation Handb. Clin. Neurol 116 55–61 [DOI] [PMC free article] [PubMed] [Google Scholar]
- McNeal DR 1976. Analysis of a model for excitation of myelinated nerve IEEE Trans. Biomed. Eng 23 329–37 [DOI] [PubMed] [Google Scholar]
- Miga MI 1998. Development and quantification of a 3D brain deformation model for model-updated image-guided stereotactic neurosurgery Engineering (Hanover, NH: Dartmouth College; ) 64–81 [Google Scholar]
- Narasimhan S, Weis J, Luo M, Simpson A, Thompson R and Miga M 2020. Accounting for intraoperative brain shift ascribable to cavity collapse during intracranial tumor resection J. Med. Imaging 7 031506. [DOI] [PMC free article] [PubMed] [Google Scholar]
- Nordin T, Wårdell K and Johansson JD 2021. 8th European Medical and Biological Engineering Conf. (Cham) vol Series ed Jarm T et al. (Springer International Publishing; ) pp 1069–77 [Google Scholar]
- Rolls ET, Joliot M and Tzourio-Mazoyer N 2015. Implementation of a new parcellation of the orbitofrontal cortex in the automated anatomical labeling atlas Neuroimage 122 1–5 [DOI] [PubMed] [Google Scholar]
- Rolston JD, Englot DJ, Starr PA and Larson PS 2016. An unexpectedly high rate of revisions and removals in deep brain stimulation surgery: analysis of multiple databases Parkinsonism Relat. Disord 33 72–7 [DOI] [PMC free article] [PubMed] [Google Scholar]
- Schmidt C and Rienen UV 2012. Modeling the field distribution in deep brain stimulation: the influence of anisotropy of brain tissue IEEE Trans. Biomed. Eng 59 1583–92 [DOI] [PubMed] [Google Scholar]
- Slopsema JP. et al. Orientation-selective and directional deep brain stimulation in swine assessed by functional MRI at 3T. Neuroimage. 2021;224:9. doi: 10.1016/j.neuroimage.2020.117357. [DOI] [PMC free article] [PubMed] [Google Scholar]
- Smith SM et al. 2004. Advances in functional and structural MR image analysis and implementation as FSL Neuroimage 23 S208–S19 [DOI] [PubMed] [Google Scholar]
- Sotiropoulos SN et al. 2013. Advances in diffusion MRI acquisition and processing in the human connectome project Neuroimage 80 125–43 [DOI] [PMC free article] [PubMed] [Google Scholar]
- Sullivan JM, Charron G and Paulsen KD 1997. A three-dimensional mesh generator for arbitrary multiple material domains Finite Elem. Anal. Des 25 219–41 [Google Scholar]
- Sweet JA, Pace J, Girgis F and Miller JP 2016. Computational modeling and neuroimaging techniques for targeting during deep brain stimulation Front. Neuroanat 10 16. [DOI] [PMC free article] [PubMed] [Google Scholar]
- Sweet JA, Walter BL, Gunalan K, Chaturvedi A, McIntyre CC and Miller JP 2014. Fiber tractography of the axonal pathways linking the basal ganglia and cerebellum in Parkinson disease: implications for targeting in deep brain stimulation J. Neurosurg 120 988–96 [DOI] [PMC free article] [PubMed] [Google Scholar]
- Tuch DS, Wedeen VJ, Dale AM, George JS and Belliveau JW 2001. Conductivity tensor mapping of the human brain using diffusion tensor MRI Proc. Natl Acad. Sci. USA 98 11697–701 [DOI] [PMC free article] [PubMed] [Google Scholar]
- Wang Q. et al. Normative vs. patient-specific brain connectivity in deep brain stimulation. Neuroimage. 2020;224:117307. doi: 10.1016/j.neuroimage.2020.117307. [DOI] [PubMed] [Google Scholar]
- Woolrich MW, Jbabdi S, Patenaude B, Chappell M, Makni S, Behrens T, Beckmann C, Jenkinson M and Smith SM 2009. Bayesian analysis of neuroimaging data in FSL Neuroimage 45 S173–86 [DOI] [PubMed] [Google Scholar]
- Wu T and Hallett M 2013. The cerebellum in Parkinson’s disease Brain 136 696–709 [DOI] [PMC free article] [PubMed] [Google Scholar]
- Wu ZX, Liu Y, Hong M and Yu XH 2018. A review of anisotropic conductivity models of brain white matter based on diffusion tensor imaging Med. Biol. Eng. Comput 56 1325–32 [DOI] [PubMed] [Google Scholar]
- Yeh FC, Verstynen TD, Wang YB, Fernandez-Miranda JC and Tseng WYI 2013. Deterministic diffusion fiber tracking improved by quantitative anisotropy PLoS One 8 16. [DOI] [PMC free article] [PubMed] [Google Scholar]
- Younce JR, Campbell MC, Perlmutter JS and Norris SA 2019. Thalamic and ventricular volumes predict motor response to deep brain stimulation for Parkinson’s disease Parkinsonism Relat. Disord 61 64–69 [DOI] [PMC free article] [PubMed] [Google Scholar]
Associated Data
This section collects any data citations, data availability statements, or supplementary materials included in this article.
Data Availability Statement
The data generated and/or analysed during the current study are not publicly available for legal/ethical reasons but are available from the corresponding author on reasonable request.


