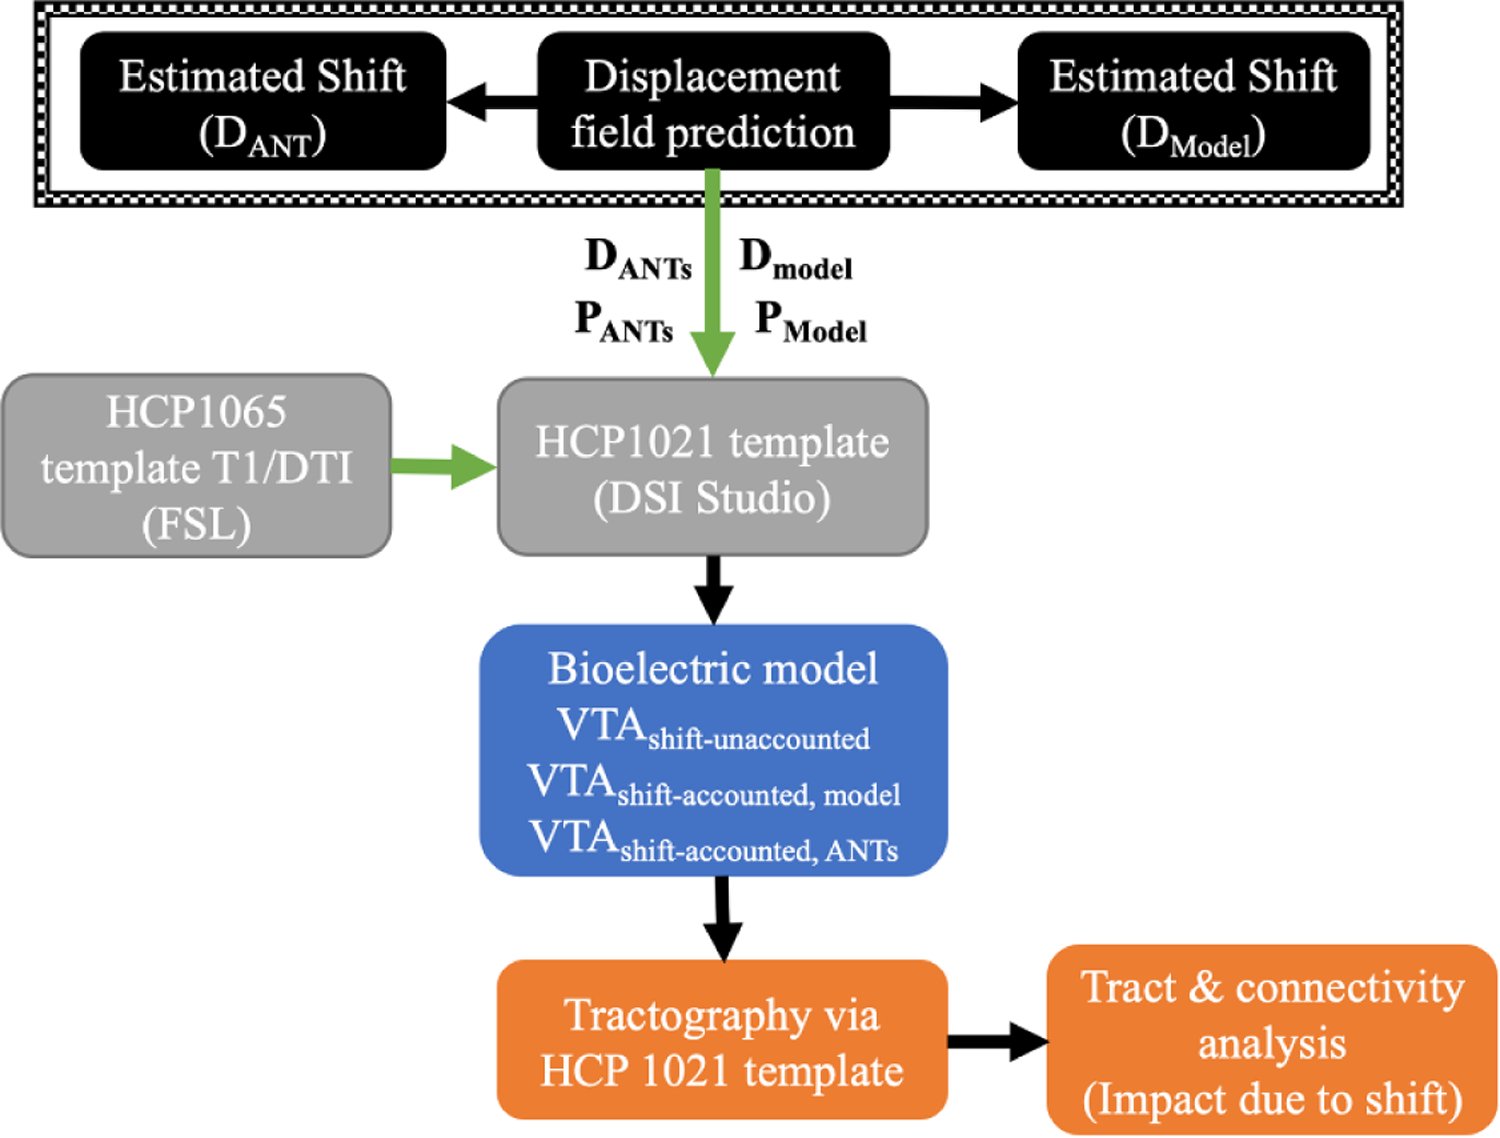
Figure 3.

A flowchart of the study: accounting for different shift considerations (model- and ANTs- predictions in black block) within the bioelectric model (blue block) for VTA estimations in HCP 1021 template (grey block), for subsequent examination of tractography (orange block). Overall analysis and modeling are performed in MNI space achieved by co-registration of T1 weighted images via ANTs (represented in green arrows).
