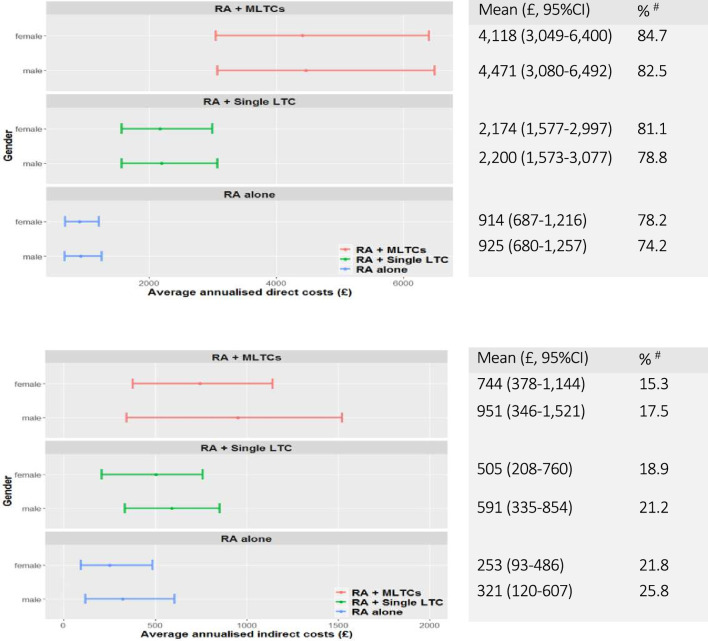
Figure 3.
(A) Average annualised direct costs per person by gender and LTC category. #The proportion of direct costs in total (direct and indirect) costs within each gender group. (B) Average annualised indirect costs per person by gender and LTC category. #The proportion of indirect costs in total (direct and indirect) costs within each gender group. LTC, long-term condition; MLTCs, multiple LTC; RA, rheumatoid arthritis.

